
Product Design, Data Visualization, & Branding © caperi.me - San Francisco ♥ ATX | Connect

Next Project

Previous Project


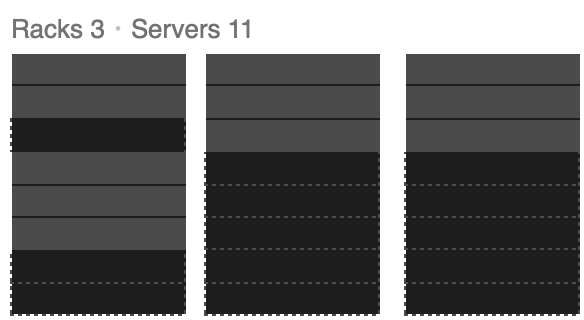
240
Endpoints tracked simultaneously, enhancing visibility across of security groups.
98%
Reduced detection time, through layered, interactive exploration features that enabled discovery of hidden network anomalies.


Security View
Enabled real-time visibility into network traffic, allowing security teams to detect and respond to unclassified IP threats targeting sensitive customer data.
My Role
Team
Duration
Product Designer Lead
Chief Technology Officer, Product Manager, Network Engineers, UI Developers, UX Researcher, and Marketing.
2 weeks sprints (6 months)

Figma


Host Detection
Drilldown Traffic
Filter Logs Mechanisms


Overview
Display virtual network traffic in real-time and security alerts from unidentified IPs.
Enable macro views and granular views to quickly identify attacks on customers networks. Provide network details as historical data to troubleshoot and remediate.
“This view should be developed to enable visibility of the security across all customers resources”
Collaborated with cross-functional teams in 2 weeks sprints from ideation to development, conducted internal workshops and 1:1s with the CTO and architecture engineers.
Today, the company and this application have been acquired by VMware.
Problem
Solution
Security View is an incremental section in a product for cloud network visualization dashboard. Displays the relationships between the physical (servers) and the virtual network resources (security groups). This is significantly better than tabular formats seen in many networking products.
My process

Research

Ideation

Design
and Testing

Outcomes
and Lessons

Unclassified/IPs
Security Policies
Security Groups (IP Servers)


Research and
Discovery
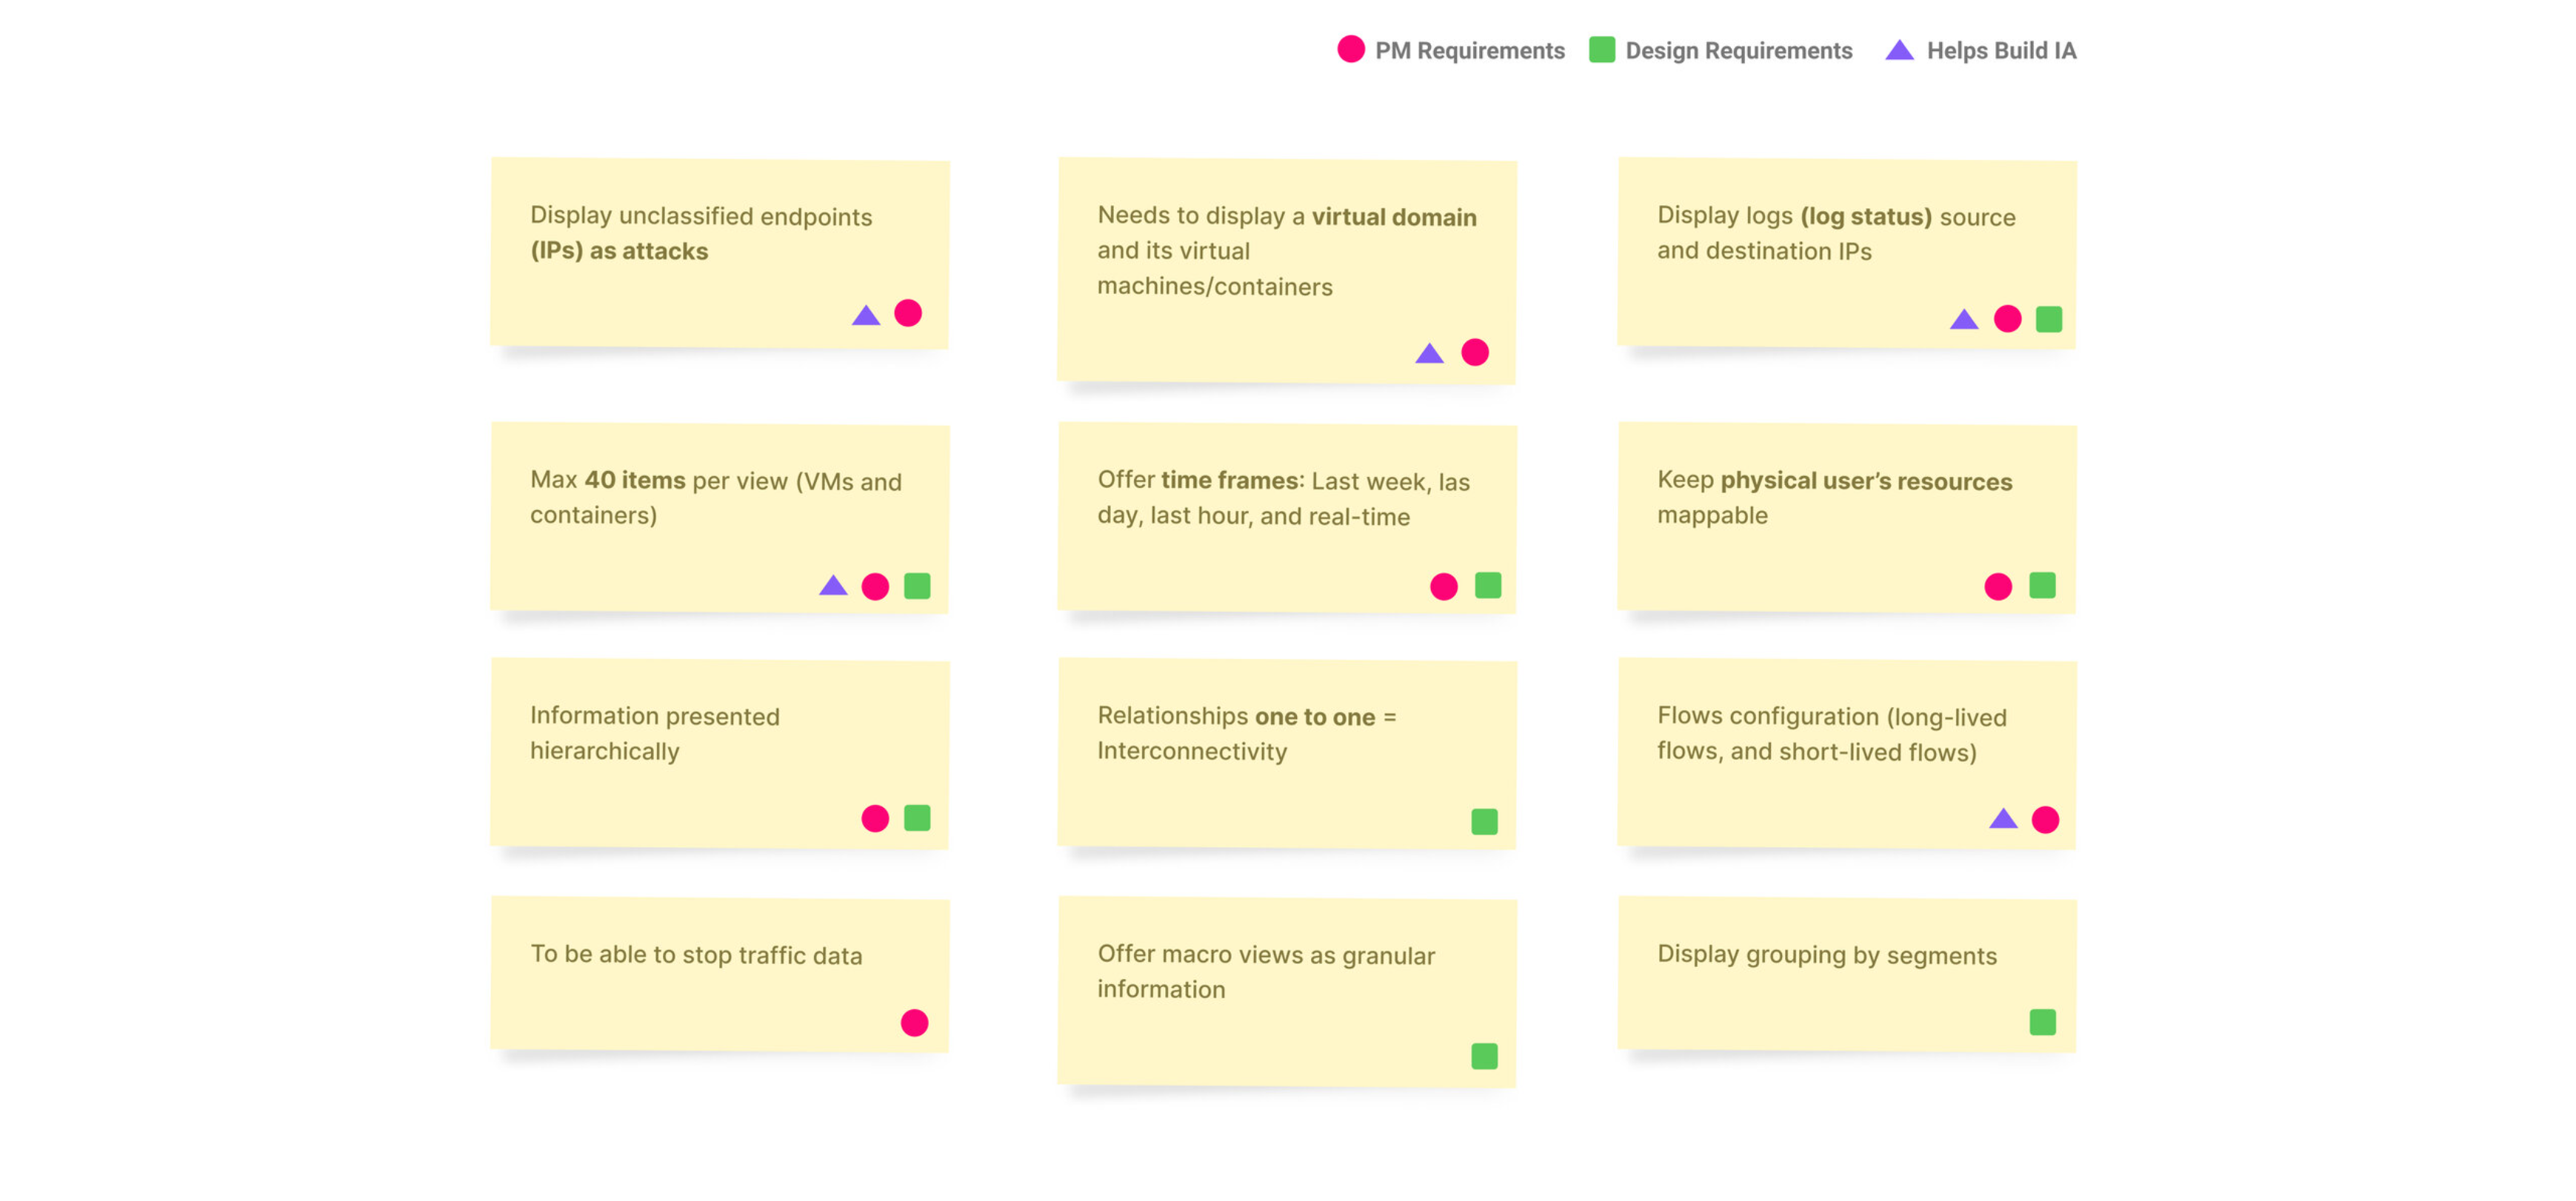
We ran workshops to review and break down the requirements for a new view we called Security View. From there, I identified and categorized different types of requirements to inform and shape the UX strategy.
This is a feature in a monitoring application called CloudApex.
Understanding Requirements
Research

Personas
and Findings
- Scalable and Interactive display of changing data sizes in one graphic.
- Highly responsive, needs to react in real-time.
I was able to gather internal data effectively thanks to the deep expertise of our engineers in both cloud and datacenters.
Challenges


Cloud Administrator
Kevin understands the cloud administration and knows the business organization.
Challenges
- Spends many hours in front of monitors
- Excess of loads of data that he is not able to manage


Datacenter Operator
Paul is responsible for the installation, maintenance, provisioning of hardware, and software support.
Challenges
- Takes time to collect old data
- Spends time searching for systems errors

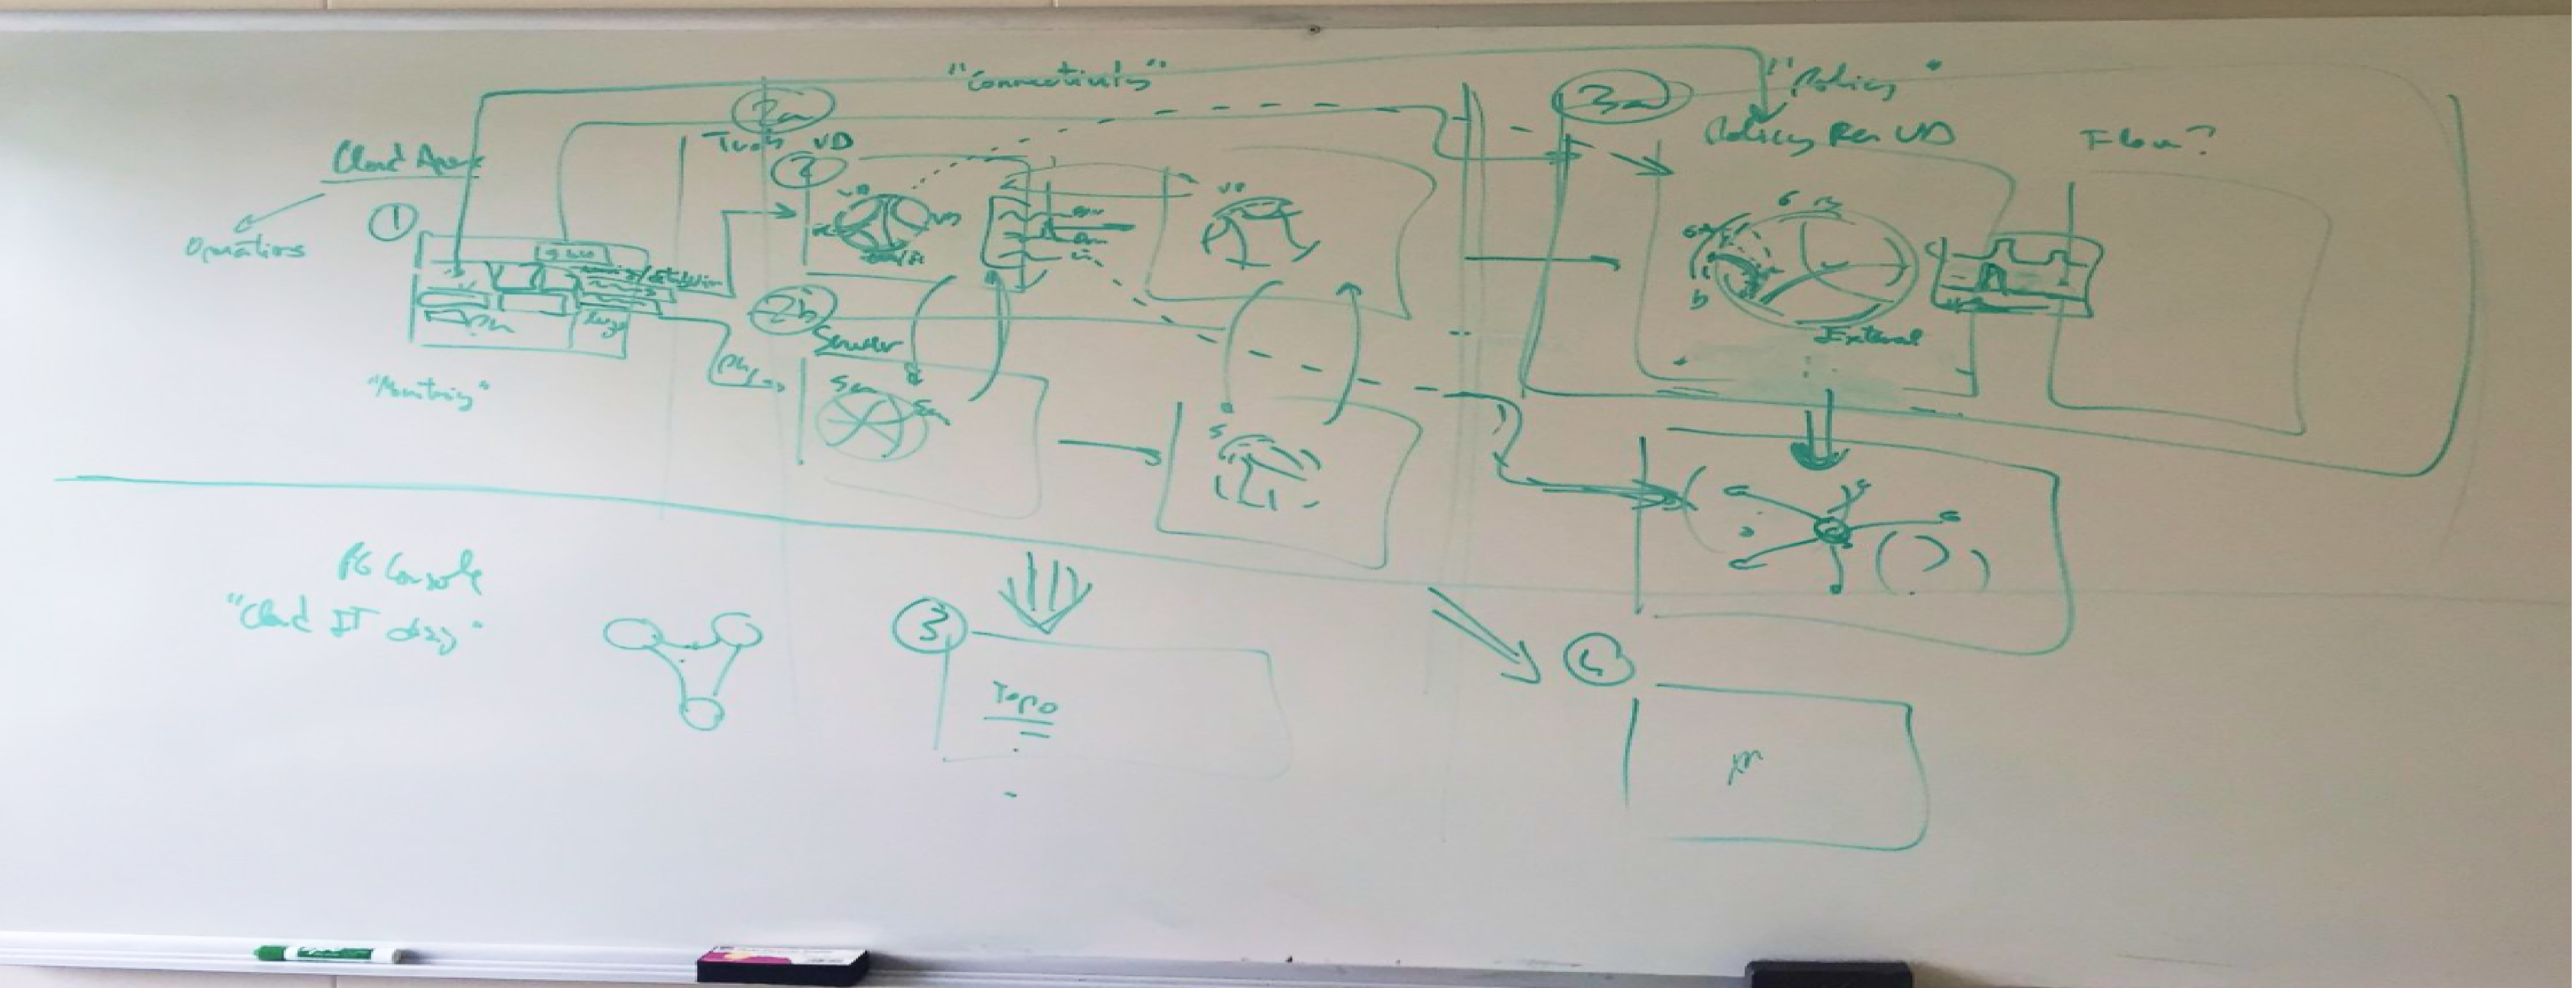
Whiteboarding & Team Alignment
Artifacts Study


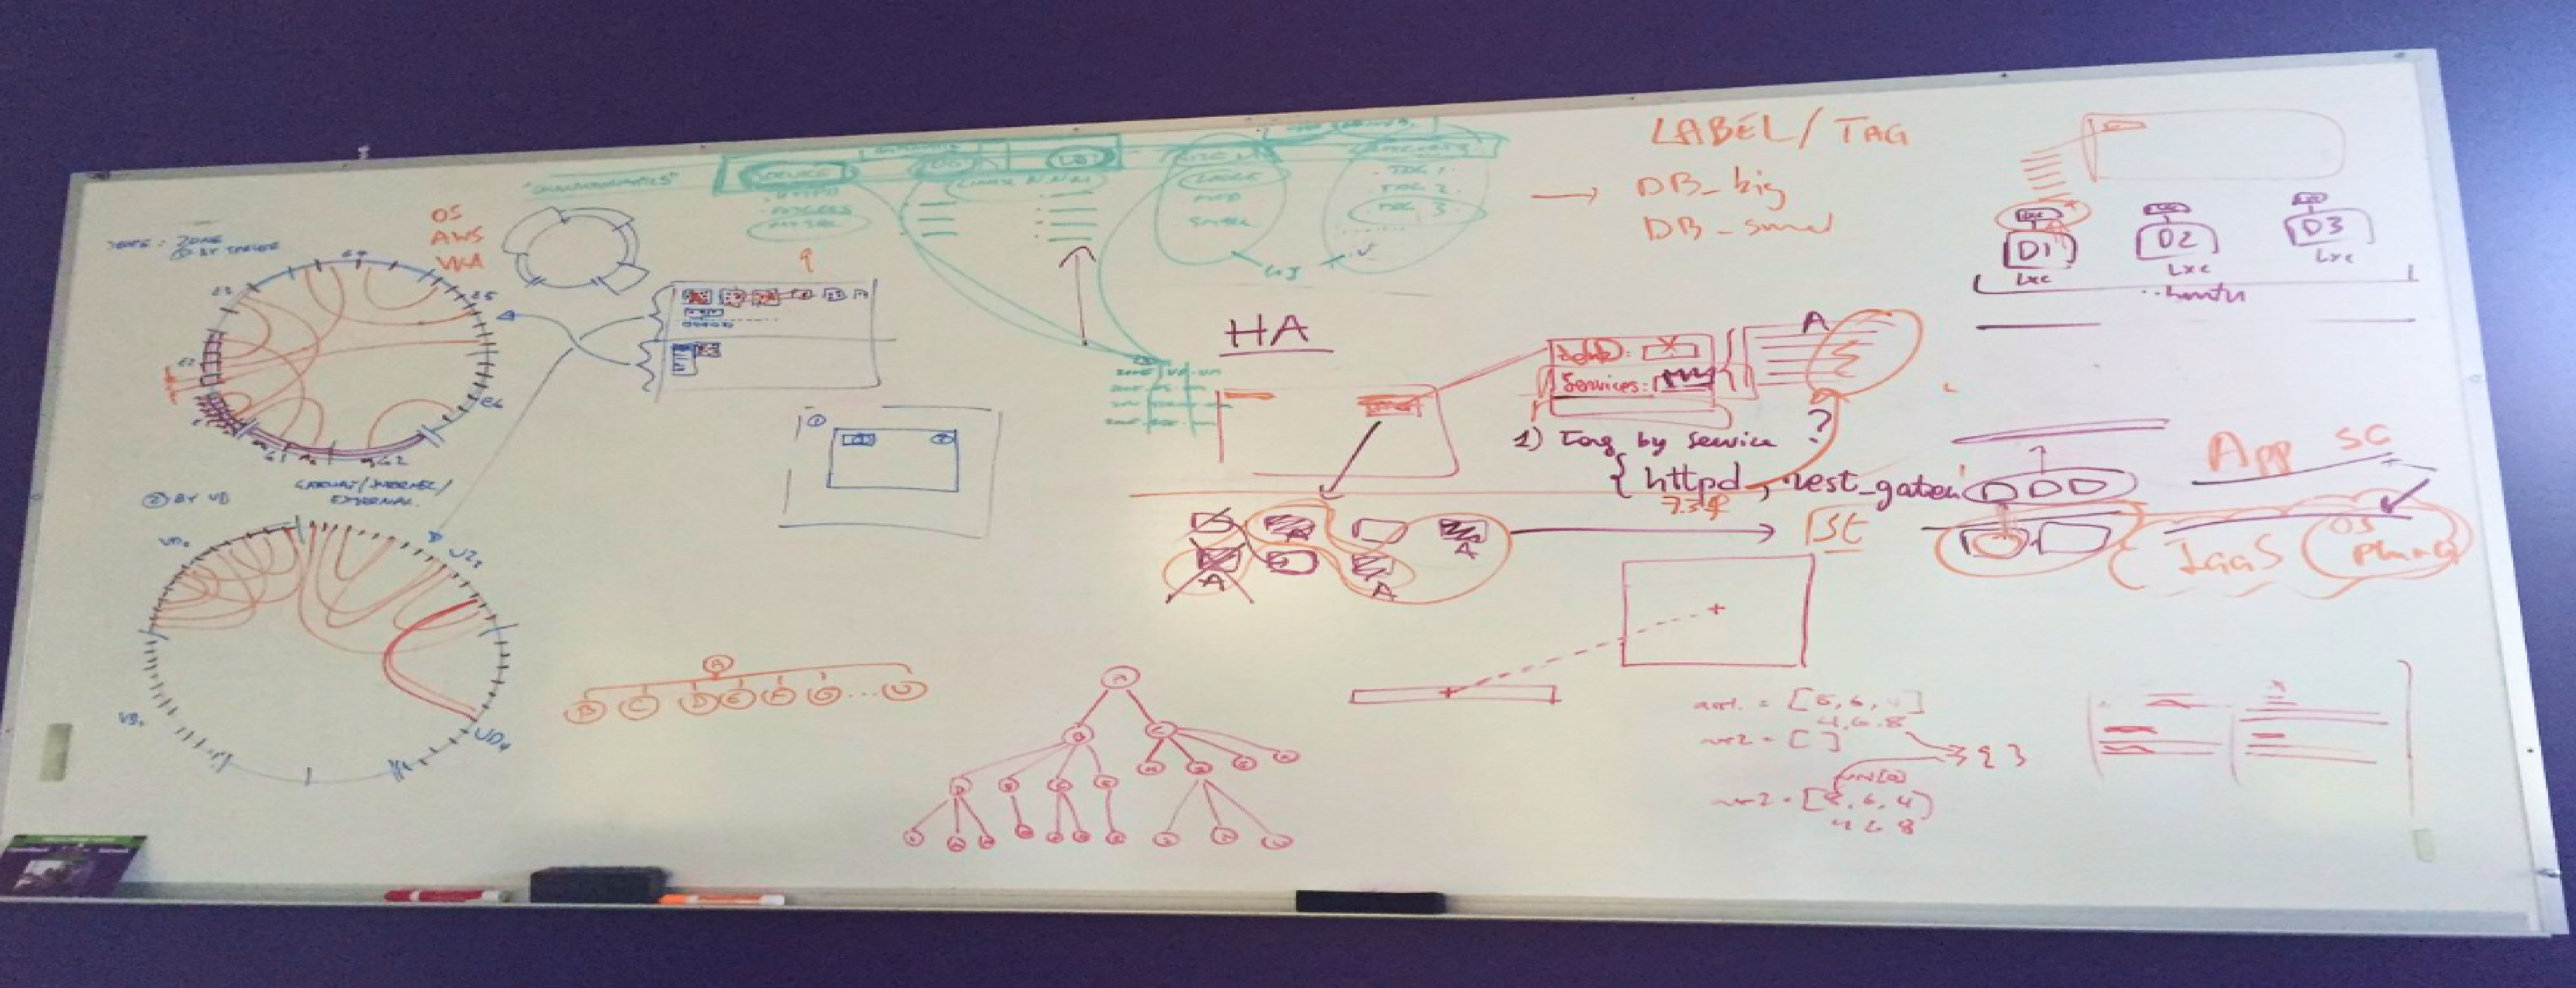
Understanding
security groups rules.
Backend capabilities.
New View Integration.
Planning navigation
and application
architecture
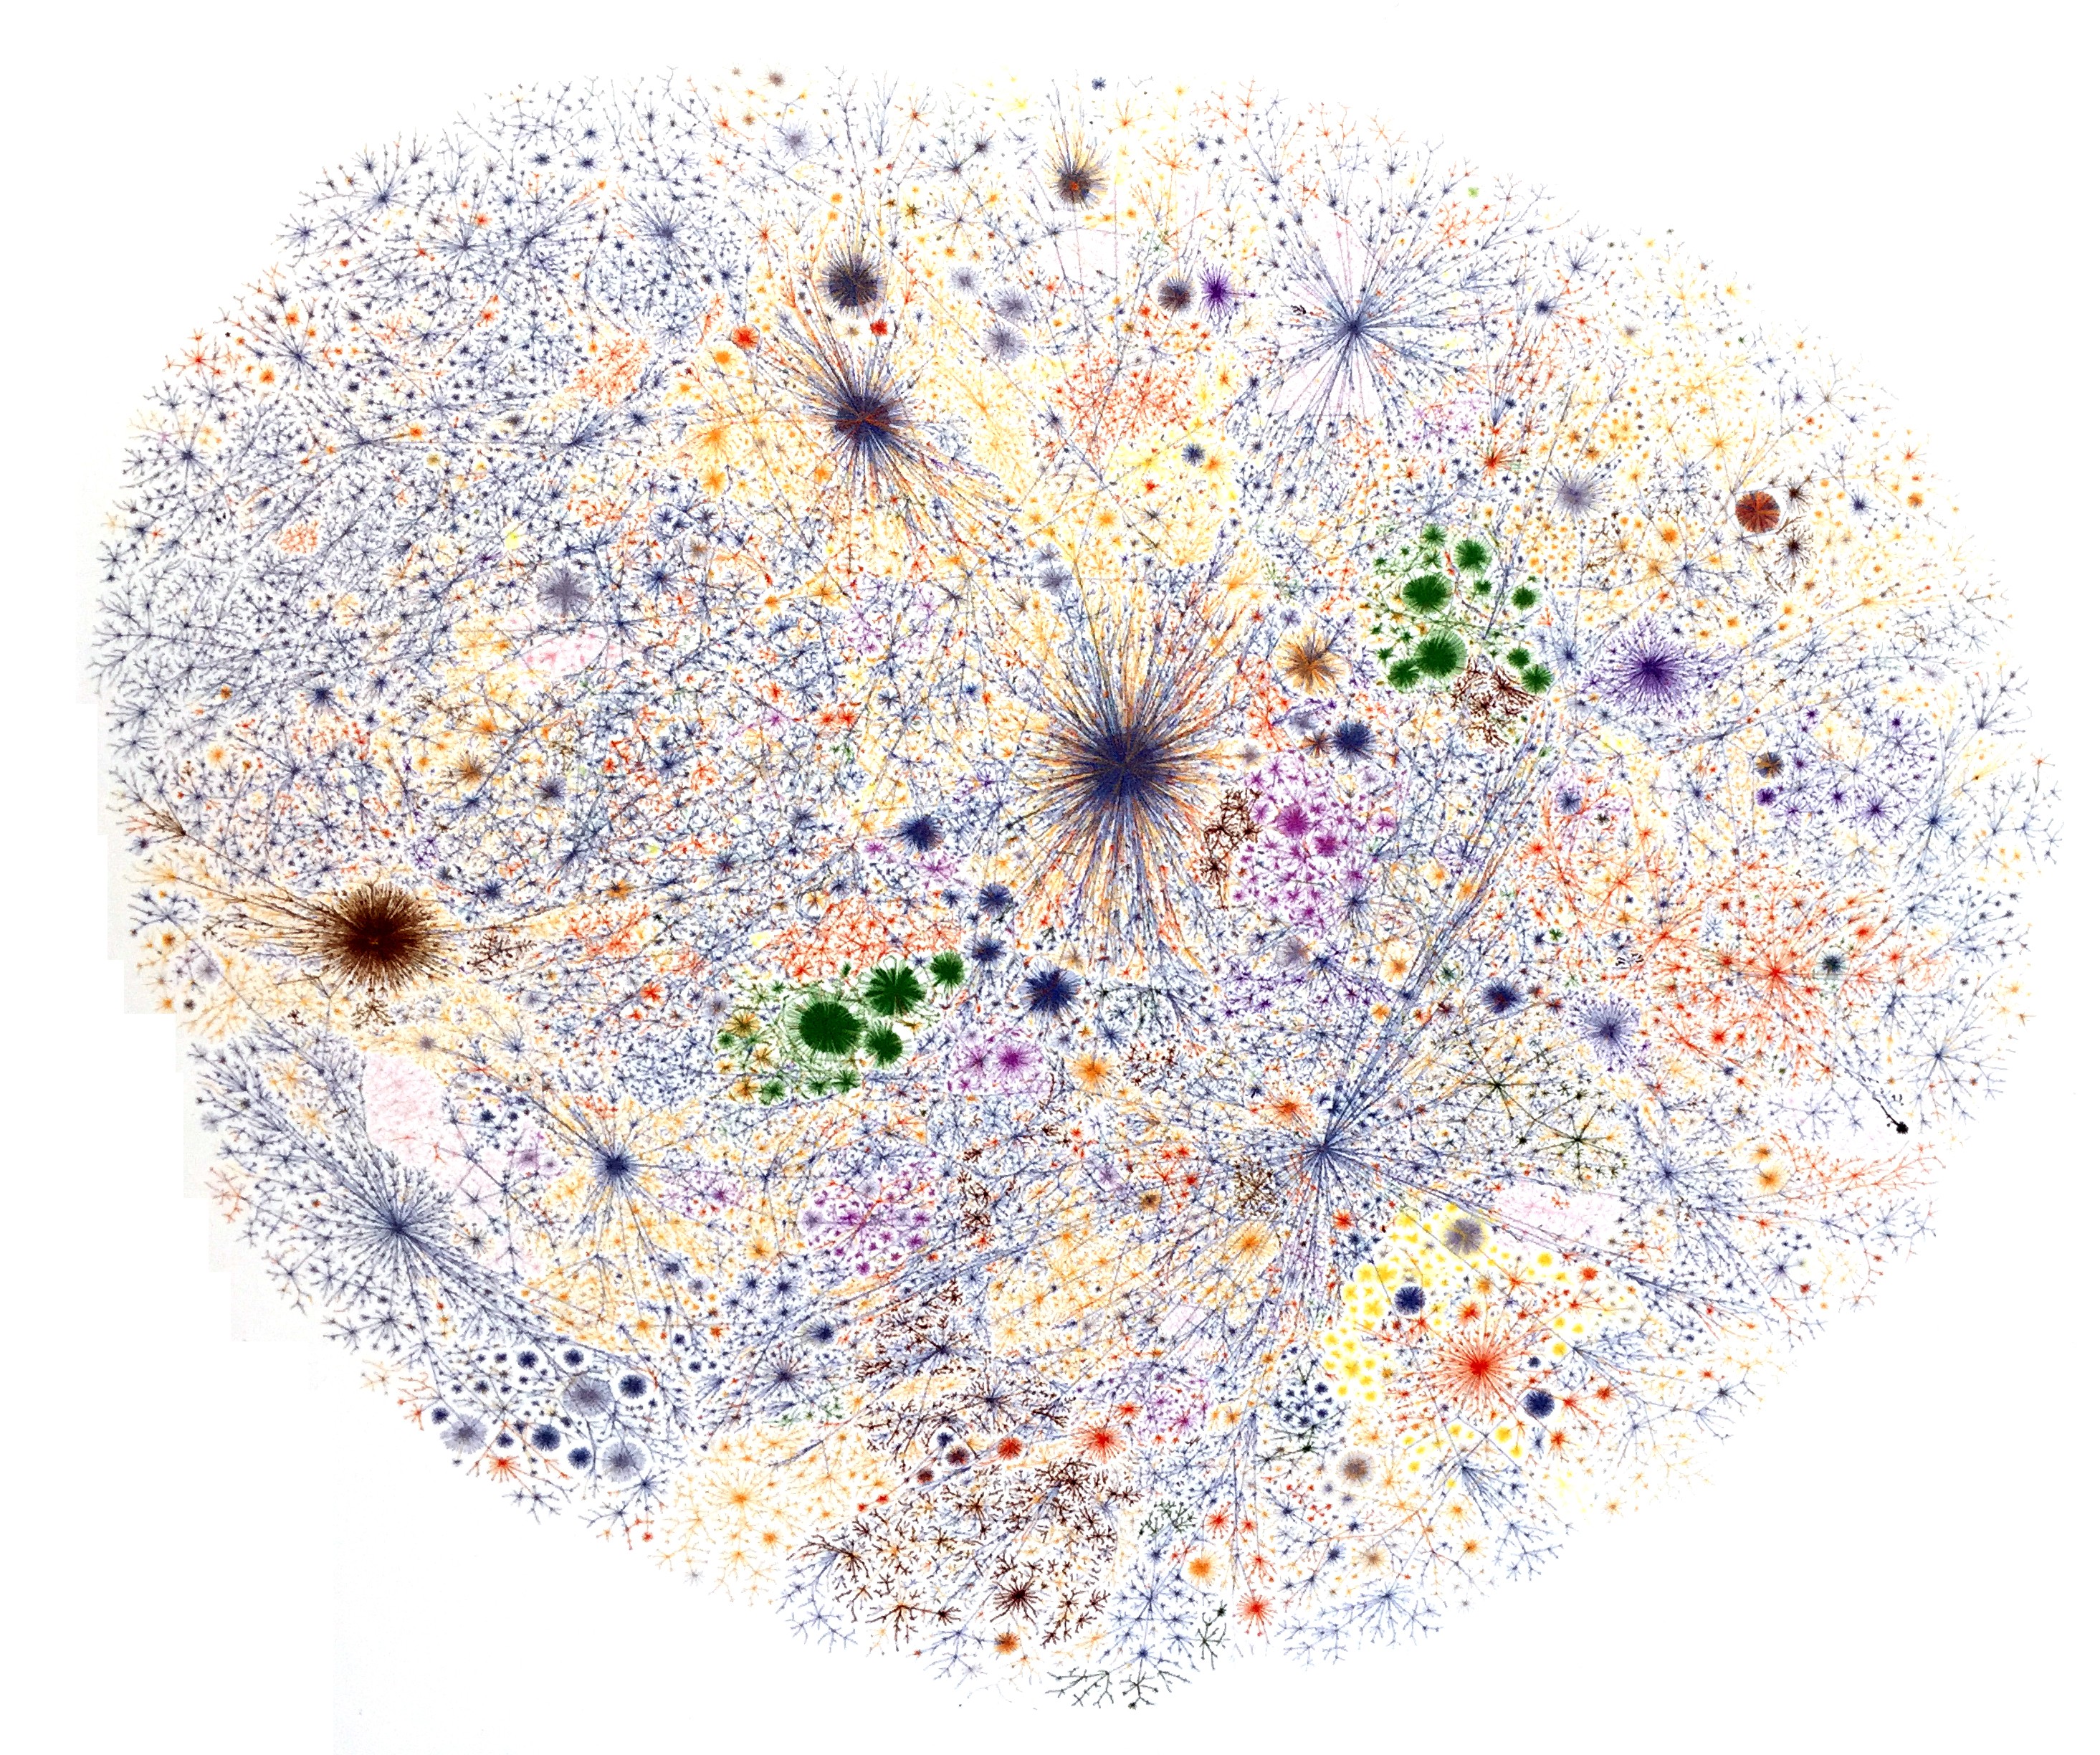
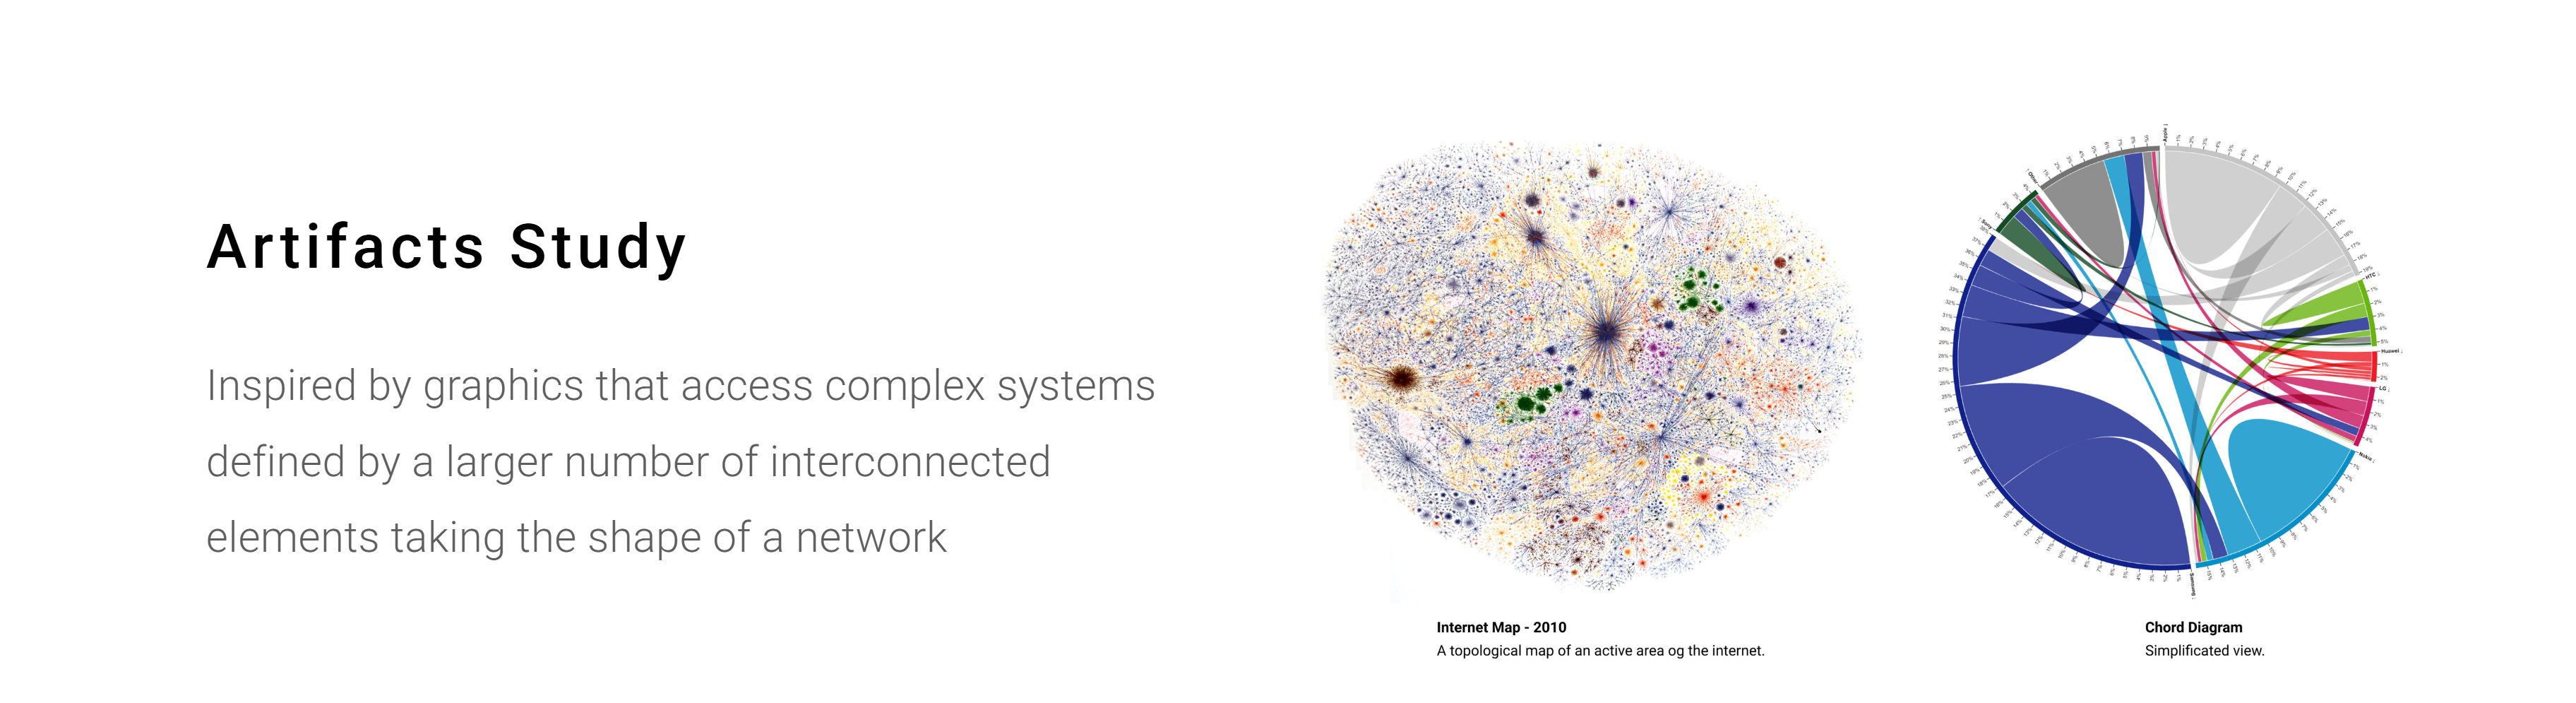
Inspired by graphics that access complex systems defined by a larger number of interconnected elements taking the shape of a network.
Internet Map - 2010
A topological map of an active area of the internet.
Chord Diagram
Simplified View
Ideation
Ideation

From sketching to user interface
Many organizations place significant emphasis on the presentation of metadata itself, rather than exploring the deeper relationships between metadata and the external factors that influence security outcomes.
We prioritize identifying what is going wrong within the network—pinpointing vulnerabilities, anomalies, or breaches—before assigning responsibility or tracing the issue to specific entities.
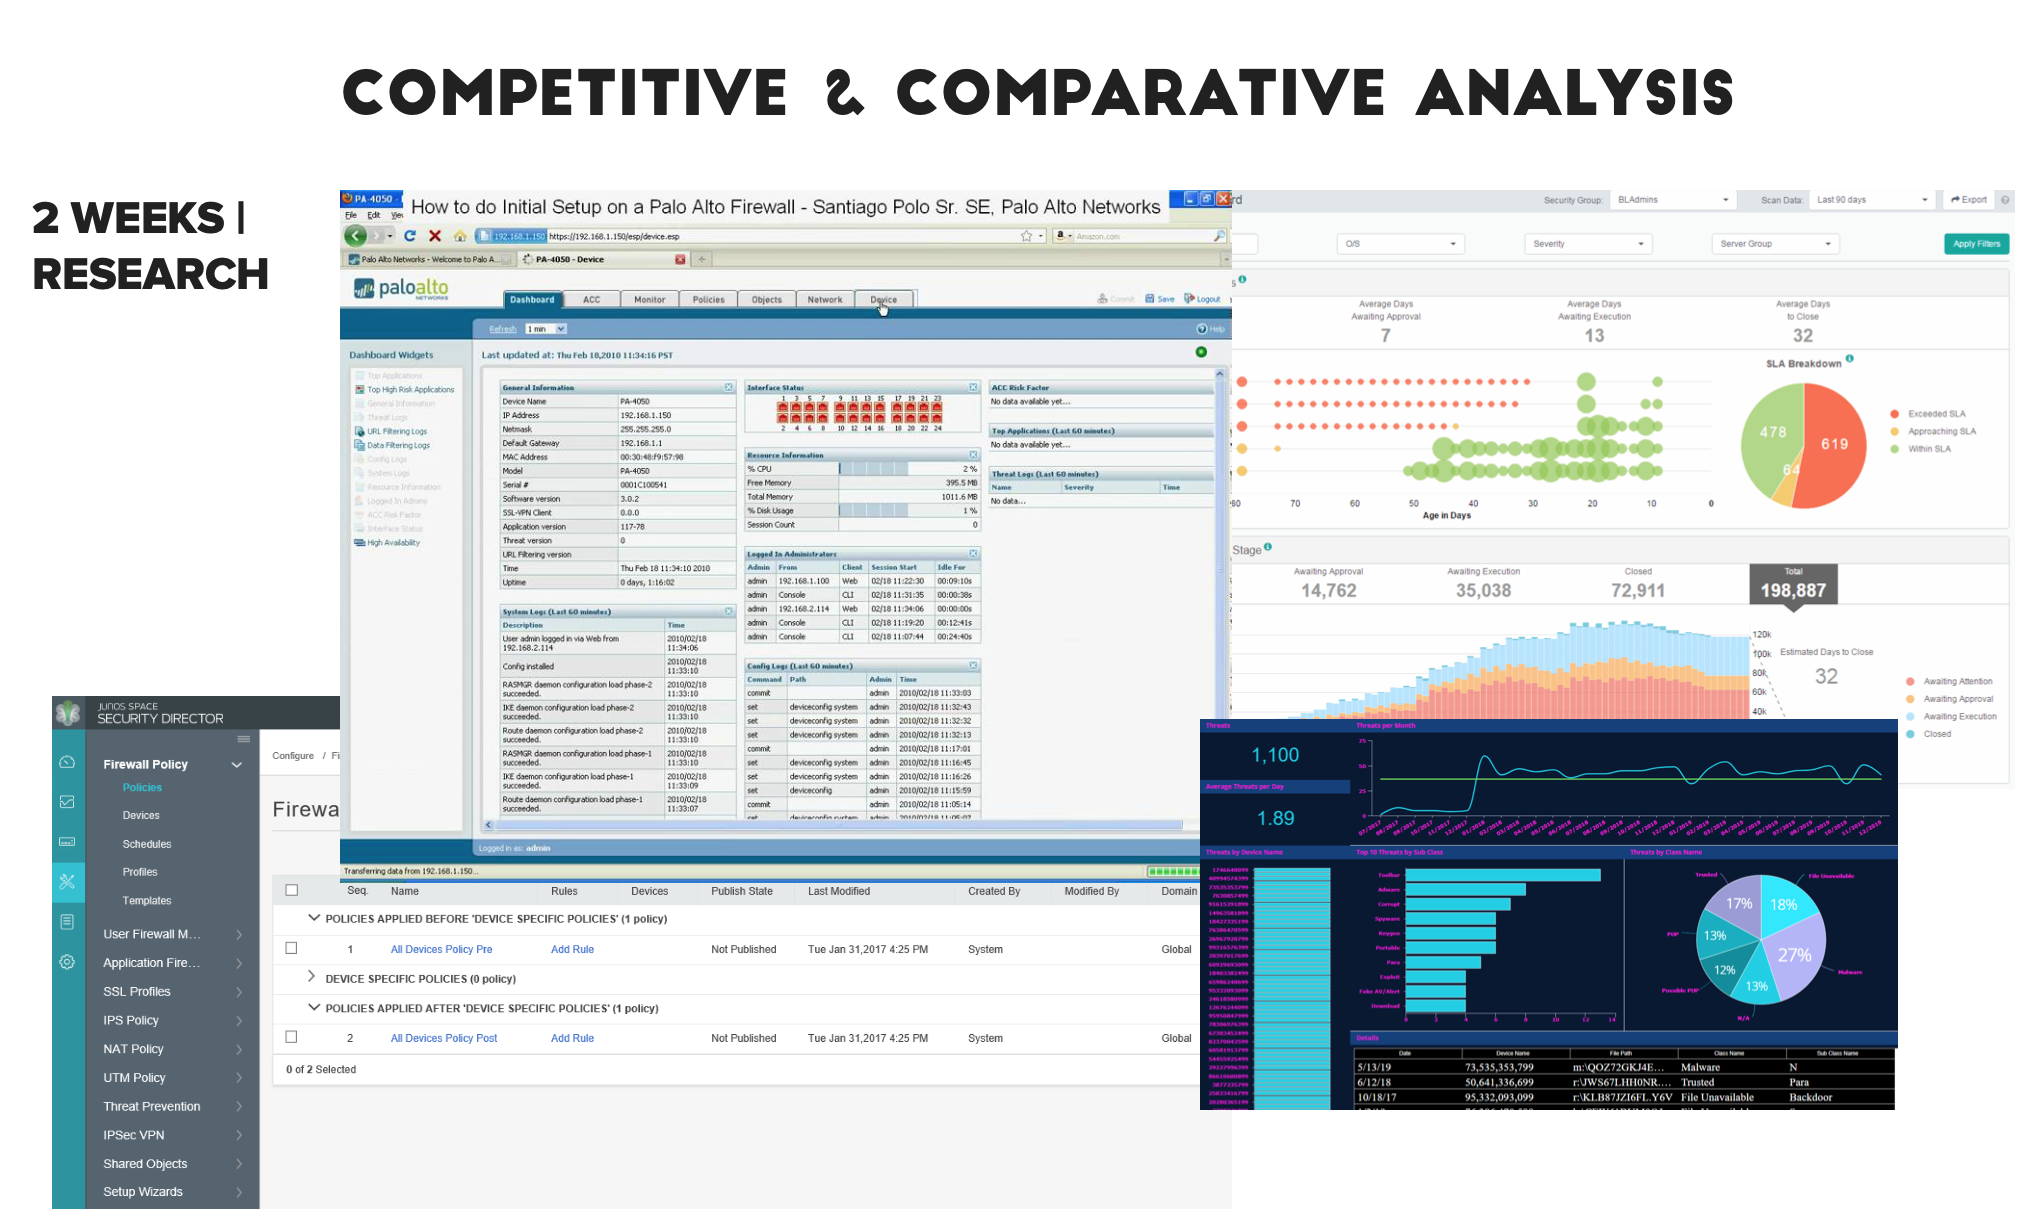
COMPETITIVE & Comparative Analysis
Understanding Network Solutions
Tabular Views
Cognitive Load
Disconnected Graphs


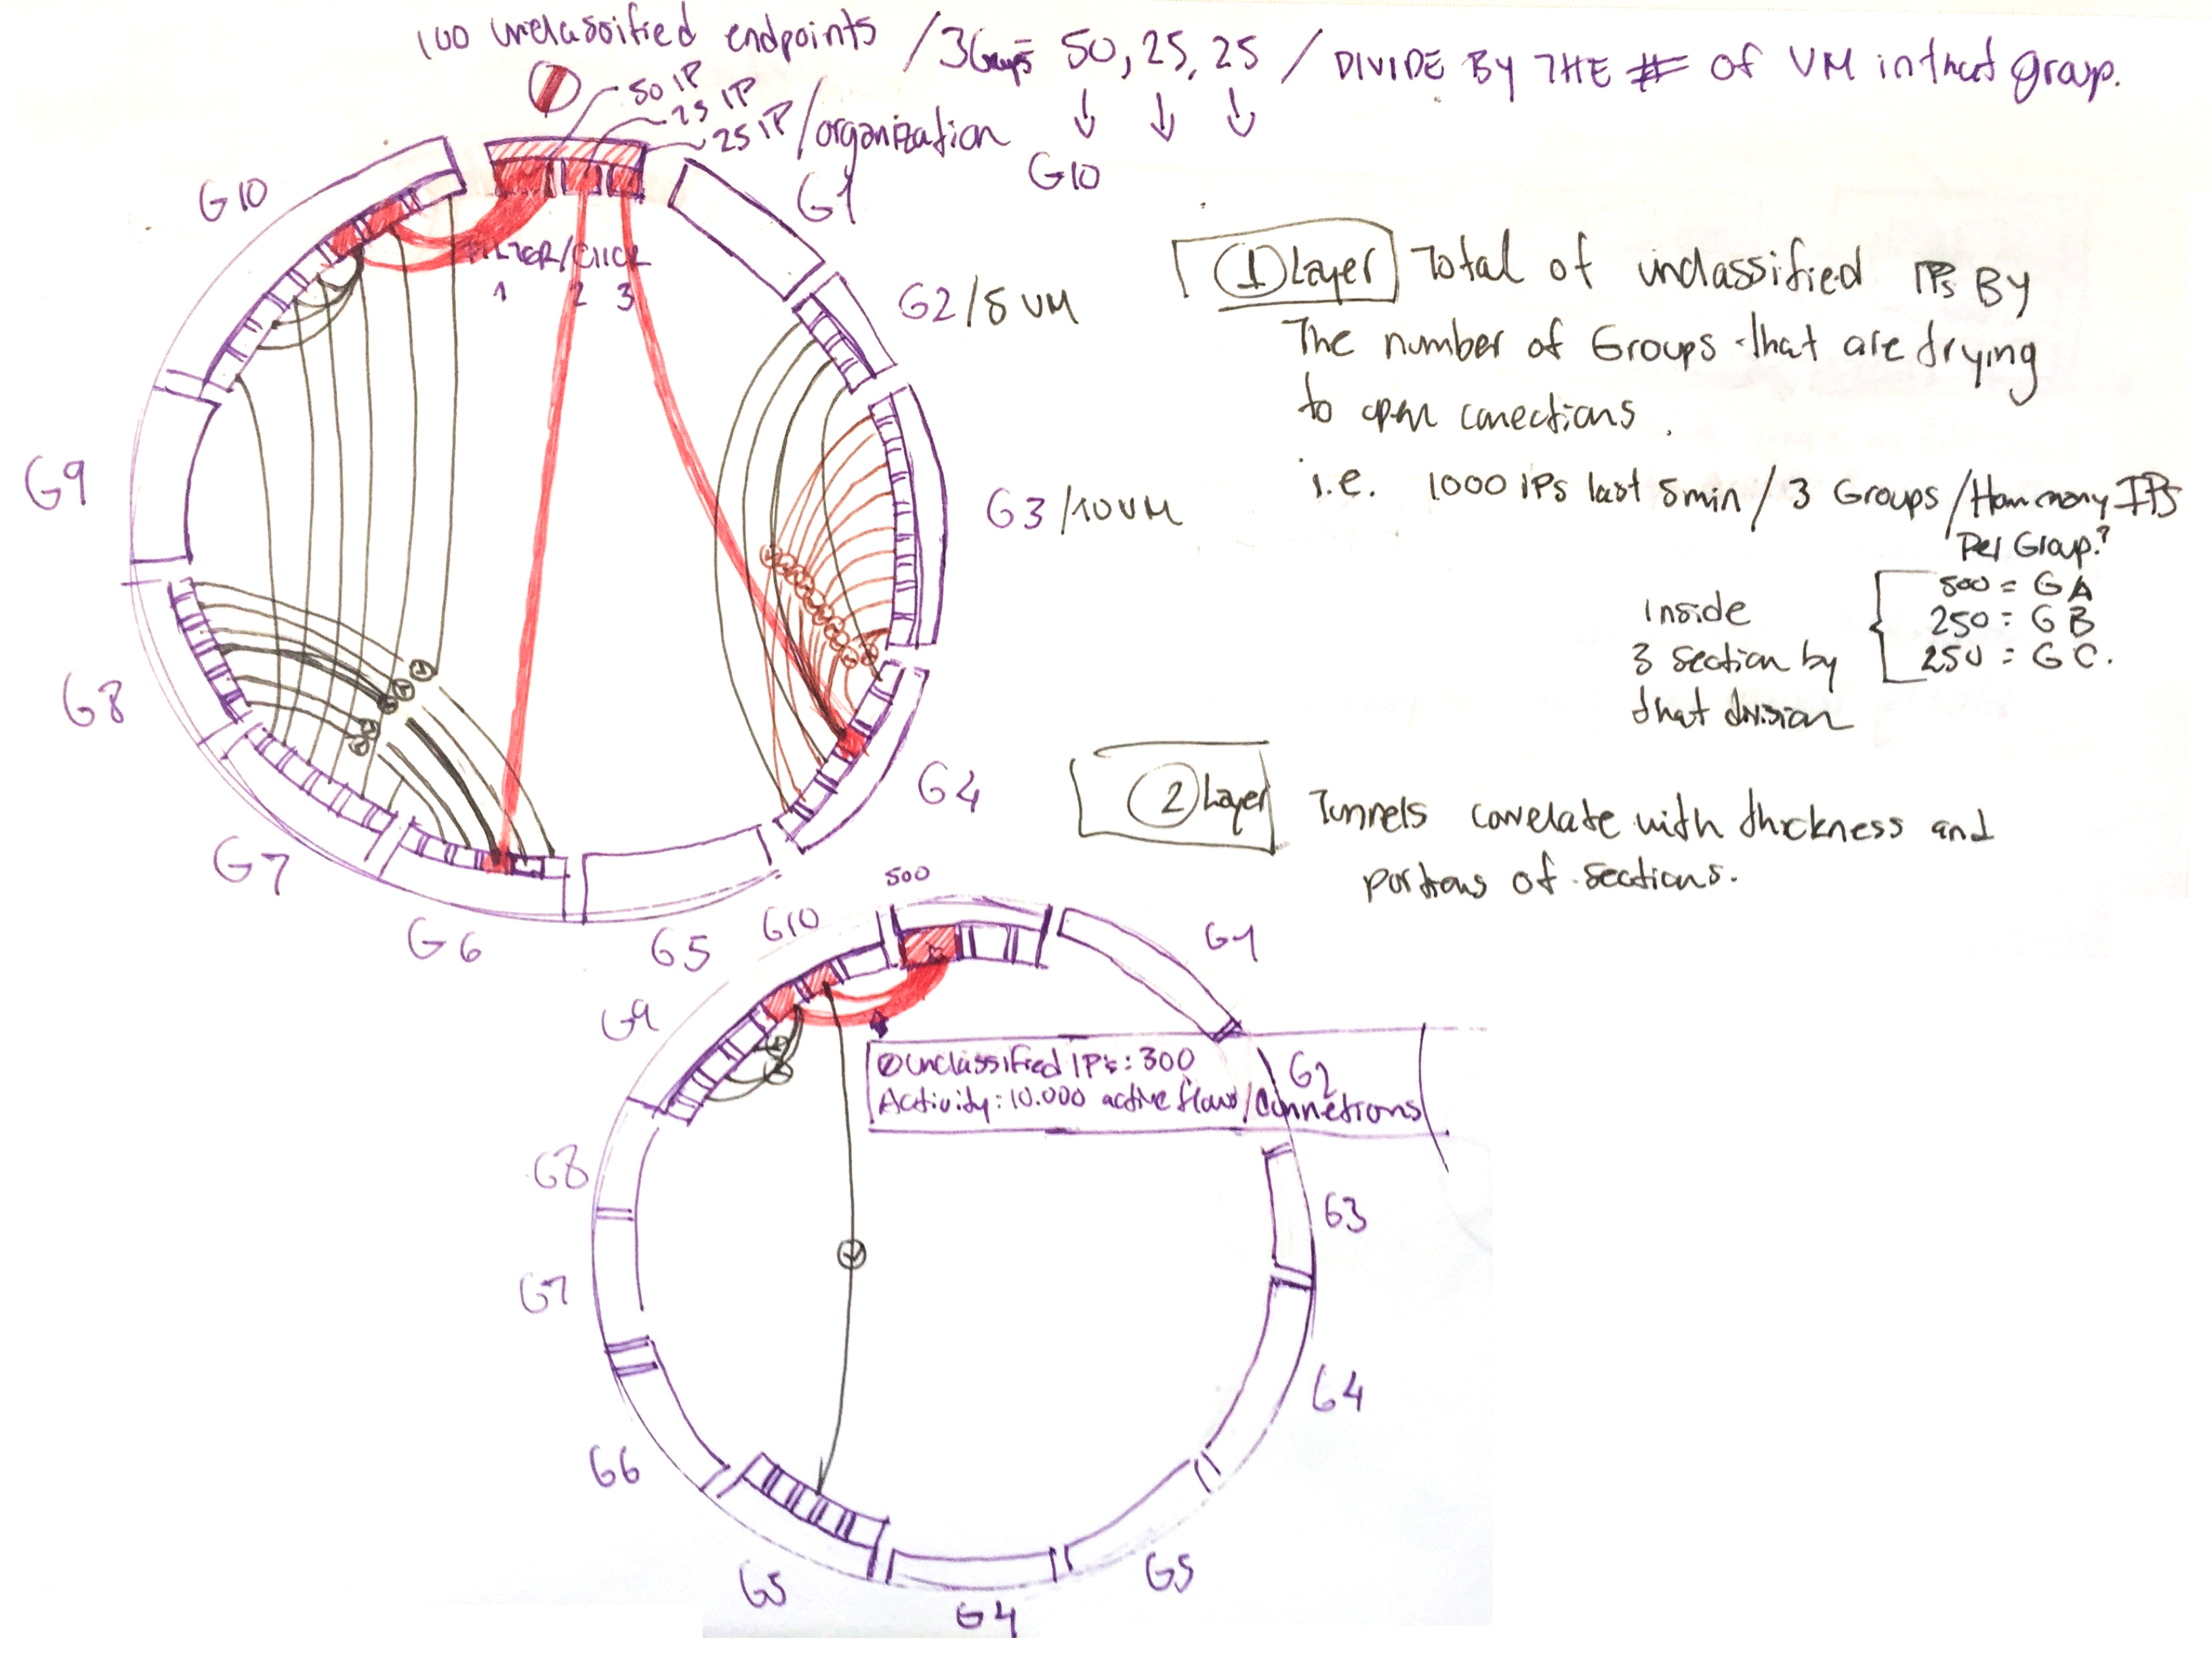
The circle can hold 40 VMs/containers required as 280 Items to scale.
Can hold macro and micro views as keep relationships.
Circles and segmentation can represents grouping and symbolize contention.
Wires represent an end-to-end endpoint
relationship.
Data visualization done correctly can encode more information, makes easier to identify patterns and trends than looking through thousands of rows on a table.
- The objective is to have the most important information readily and effortlessly available.
- Quickly point out/highlight unclassified IP’s that deserves immediate attention.
- Use drilling down methods.
- Achieve eloquence thought simplicity.


Why Data Visualization using a Dashboard?
Explored D3 libraries to understand graphics behaviors.

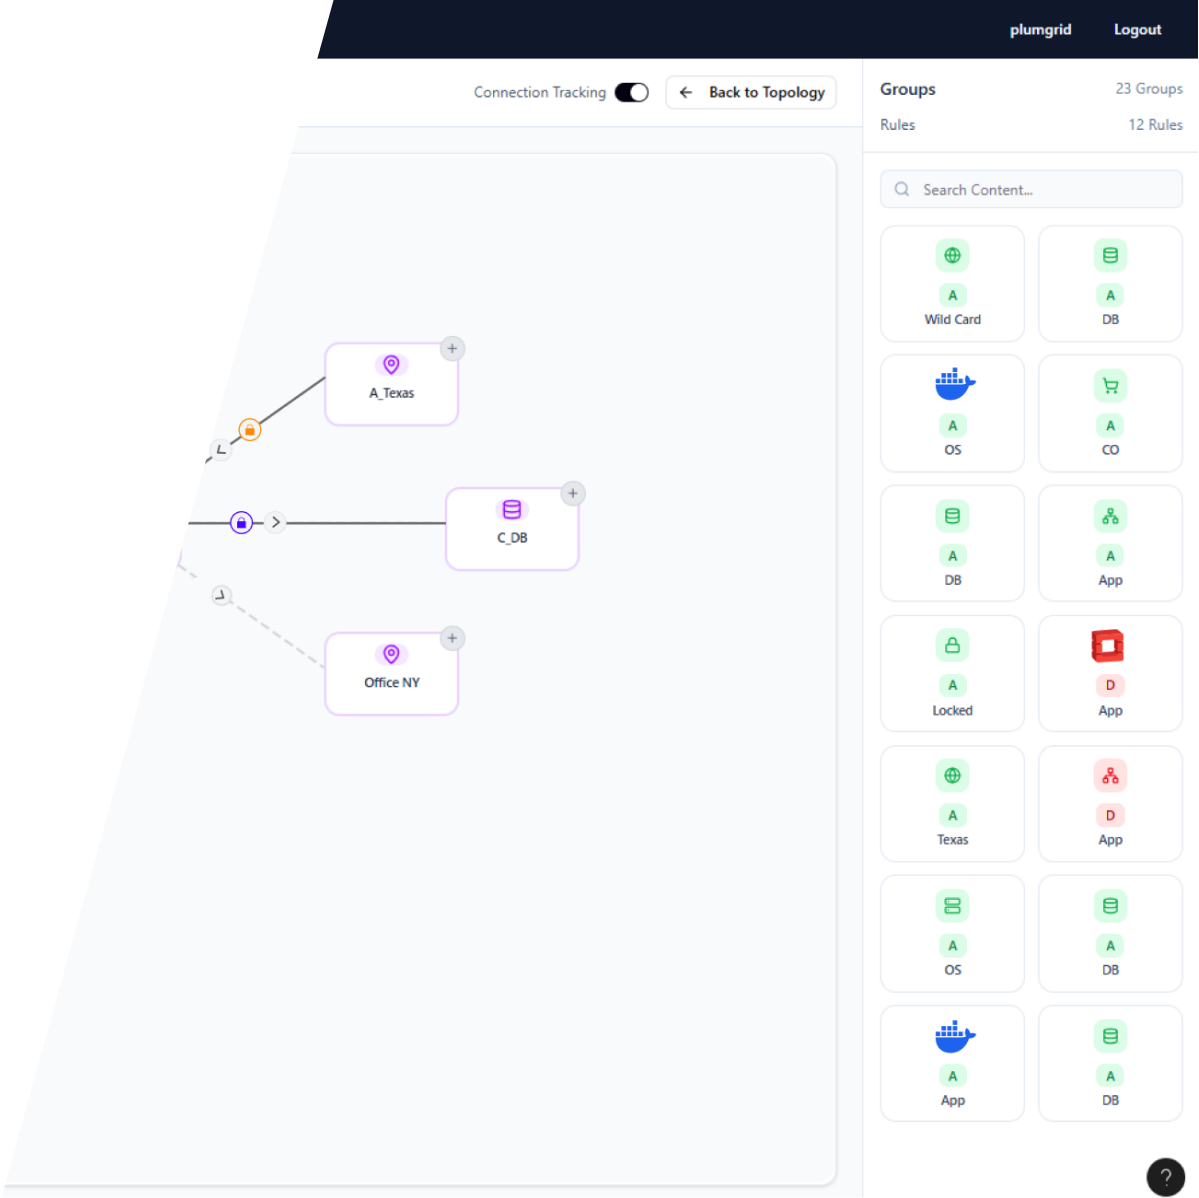
View Security Policies
Design
Design
and Testing

Security Groups View is a section of a monitoring application that displays all virtual (VMs and containers) and physical resources (servers) associated with a customer. Users can access this view through two distinct menu paths.
Security Policies are applied in
a configurational platform to the virtual domains endpoints, and Security Groups View is the result of it.
Dashboard Functionalities
Understands users and their needs. The data offered was vast and changing, it was important to offer in a glance the information the users needed immediately.
Design with scale in mind. Build a solution that can scale along with SDN technology and provide solutions to front-end.
Explore other ways of displaying data. Try and find analogies that bring more meaningful meanings for the user as humans, visually interesting, and explore different ways of expressing and encoding the data… variation of color, shape, movement, proximity, and relationships, etc.
Takeaways
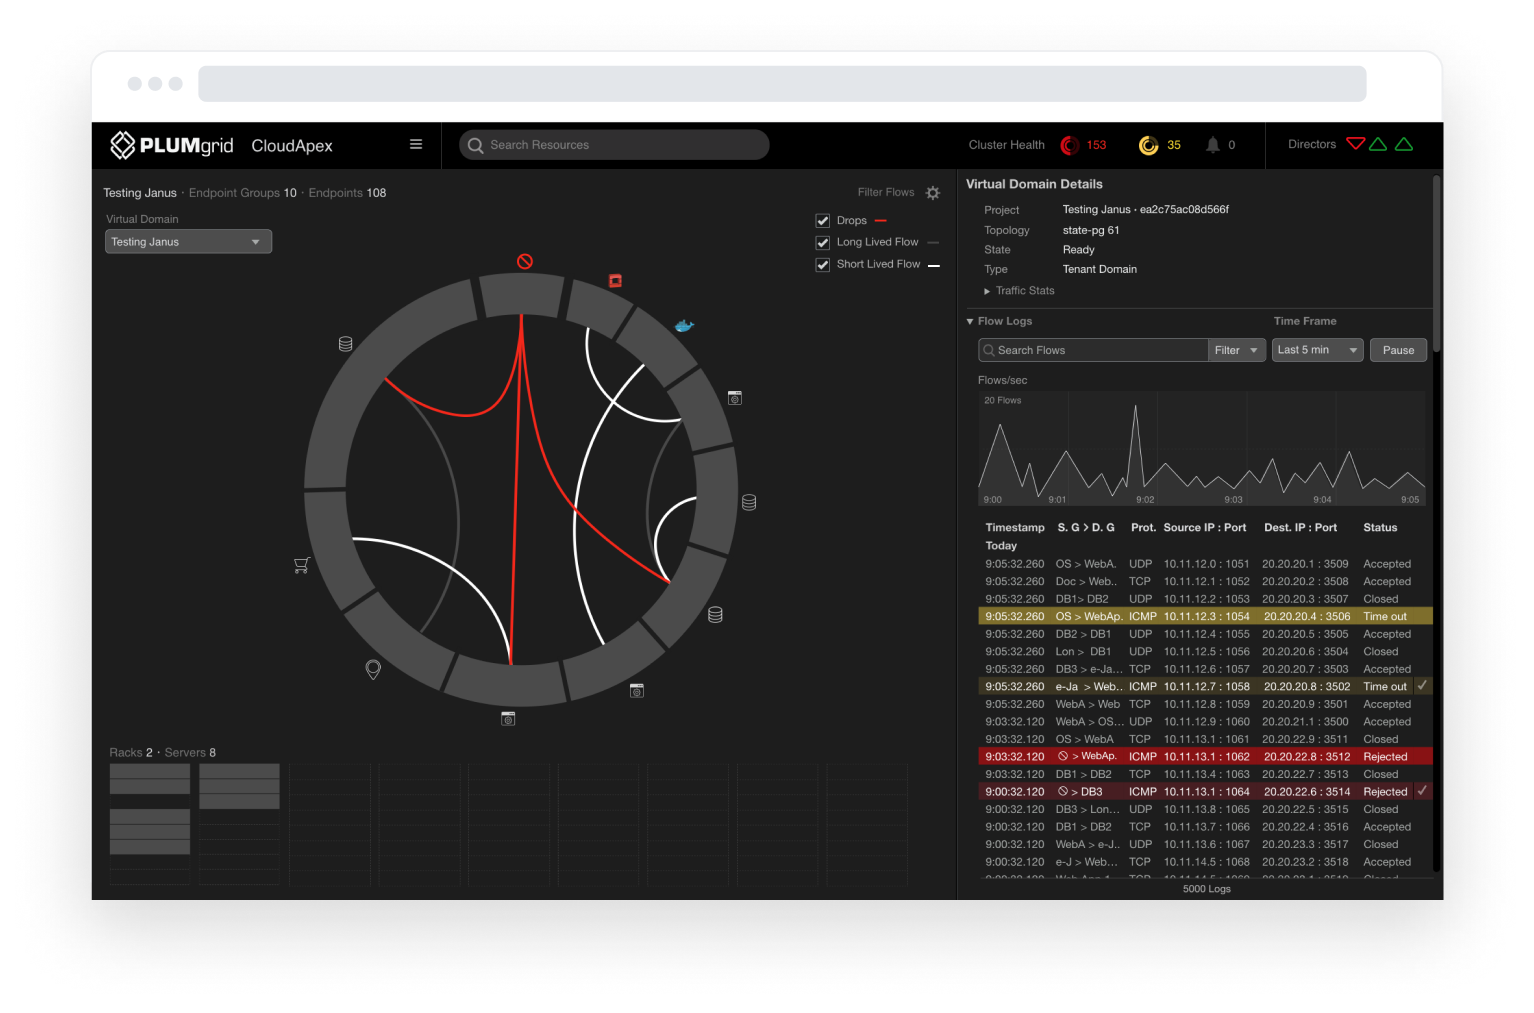
UX Solution
Security Groups
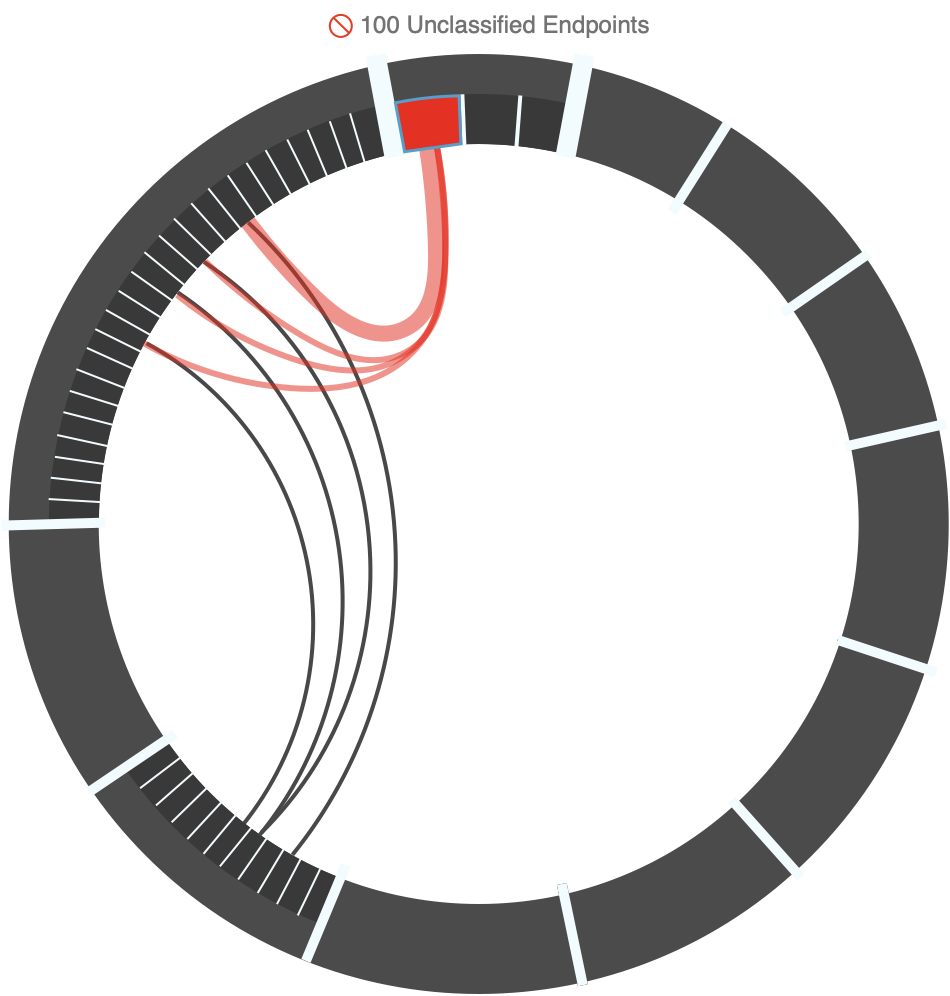
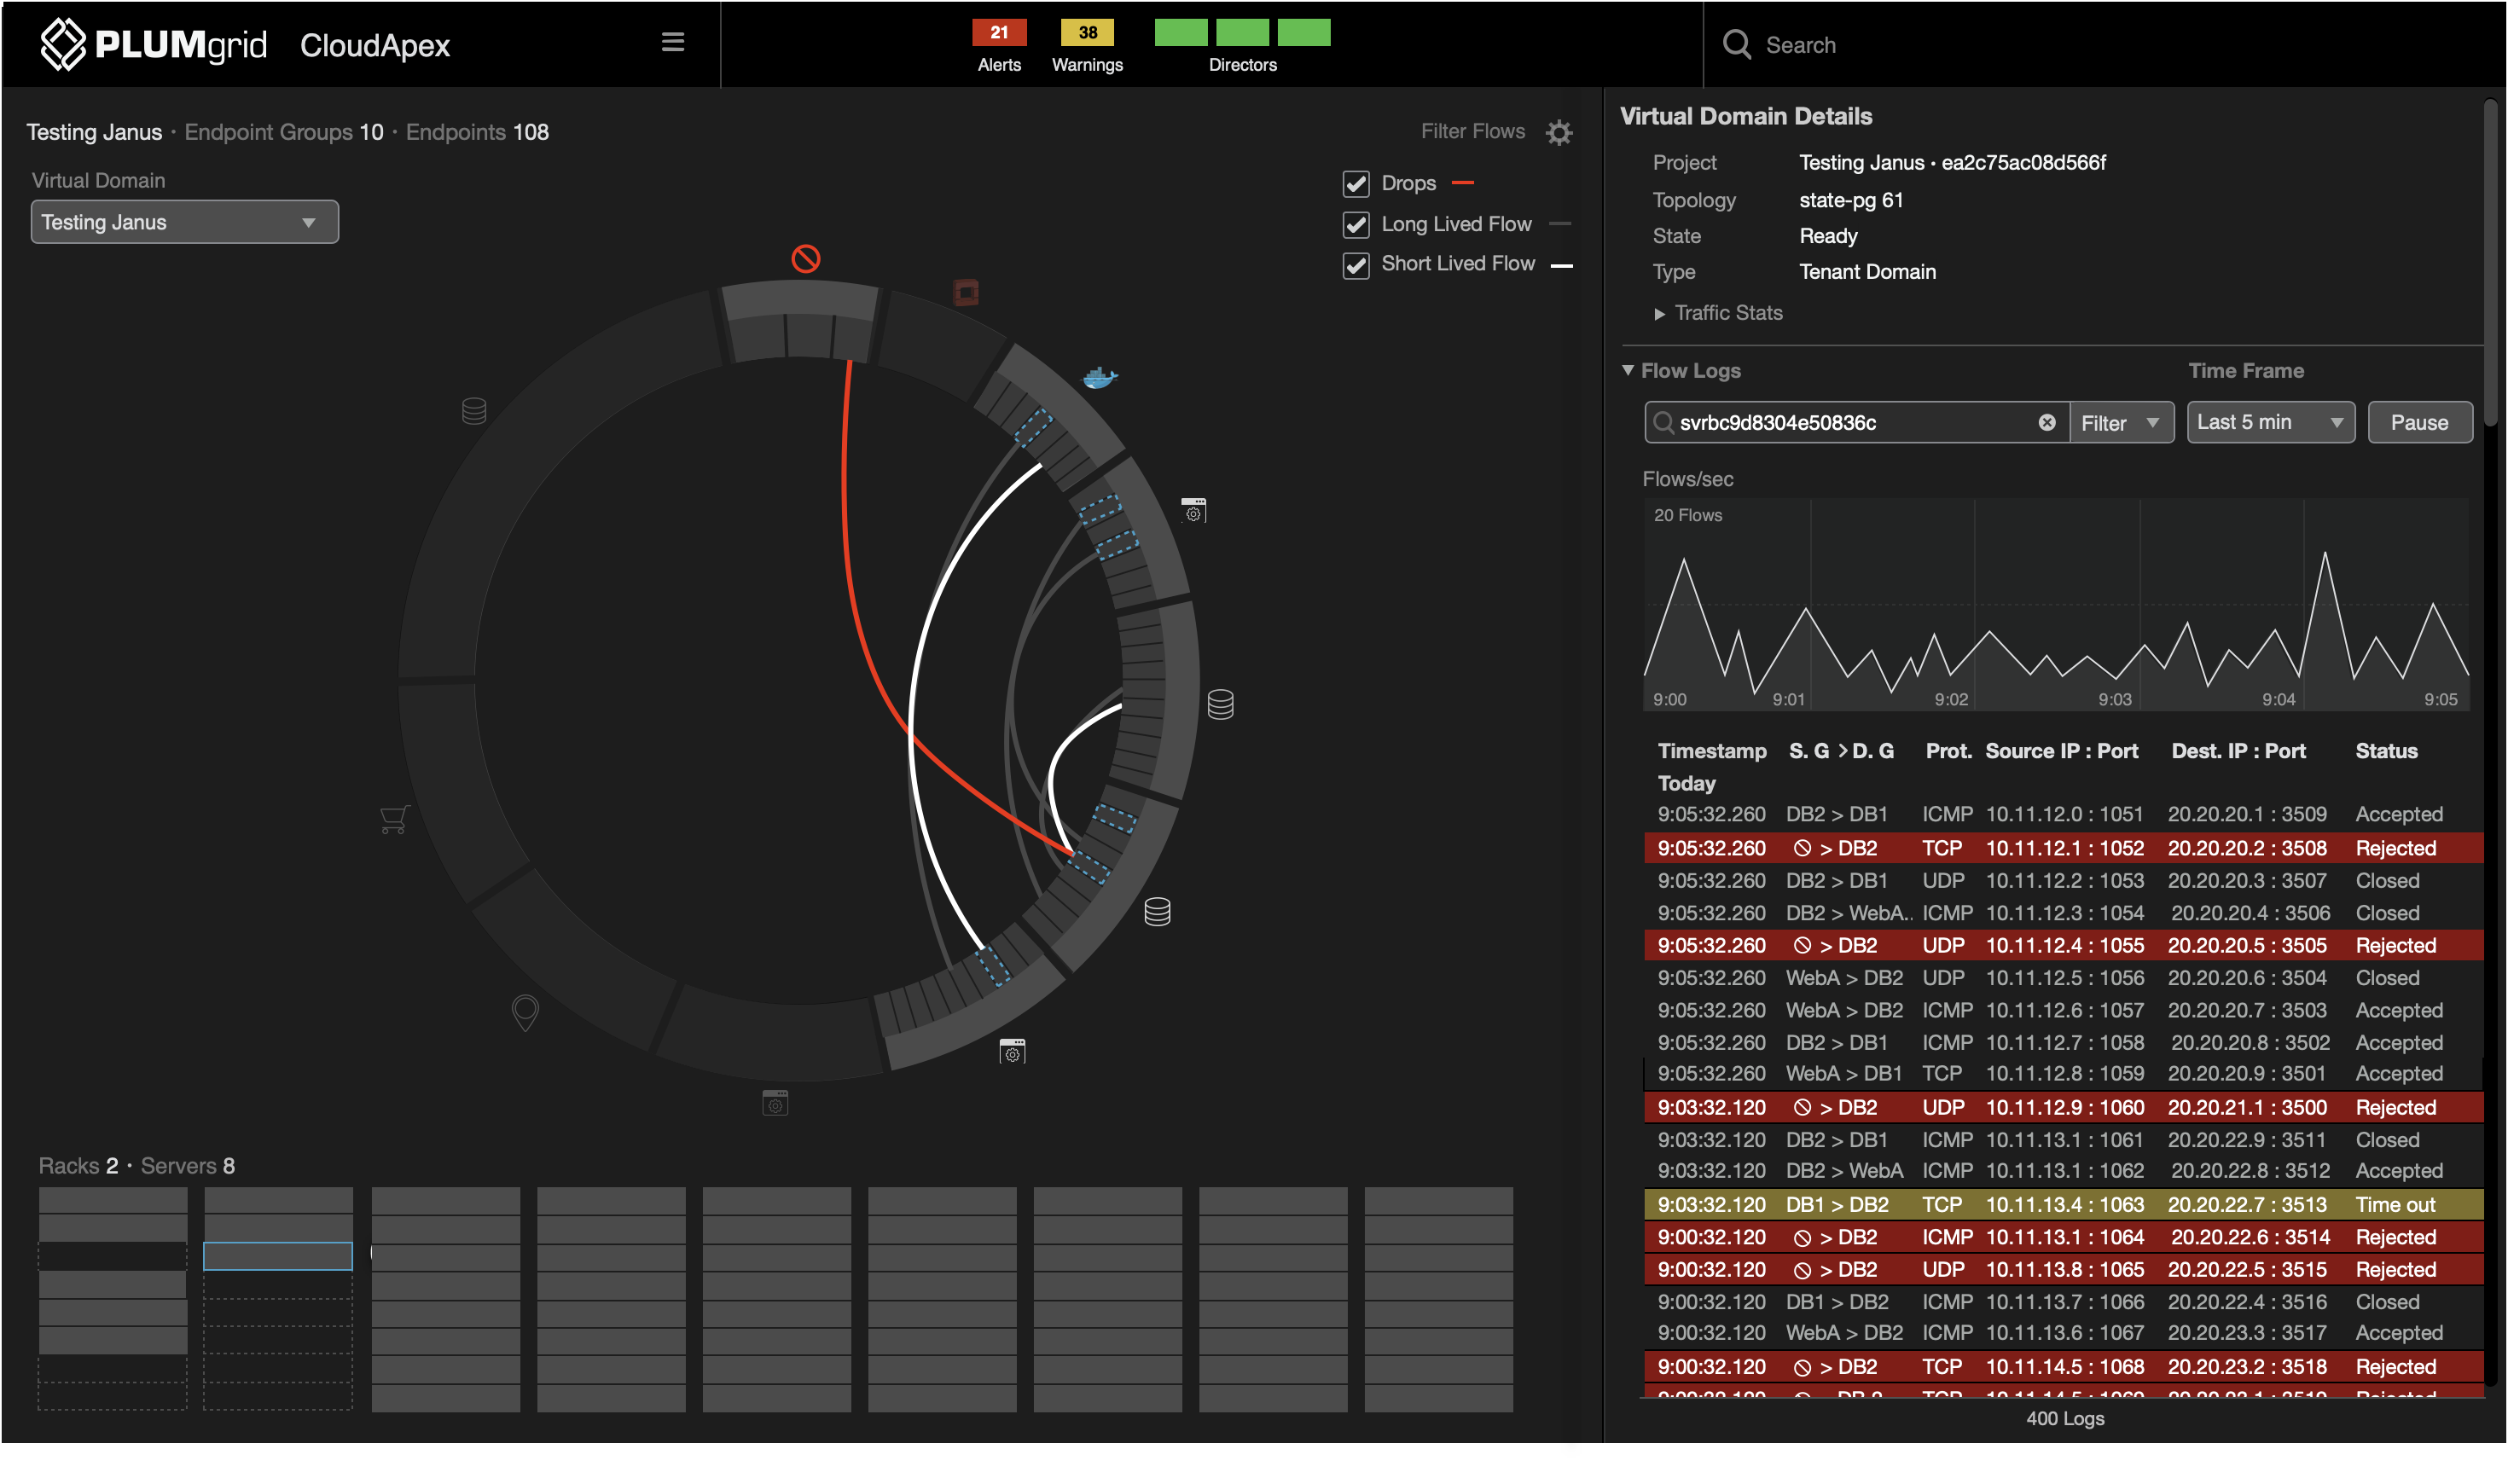
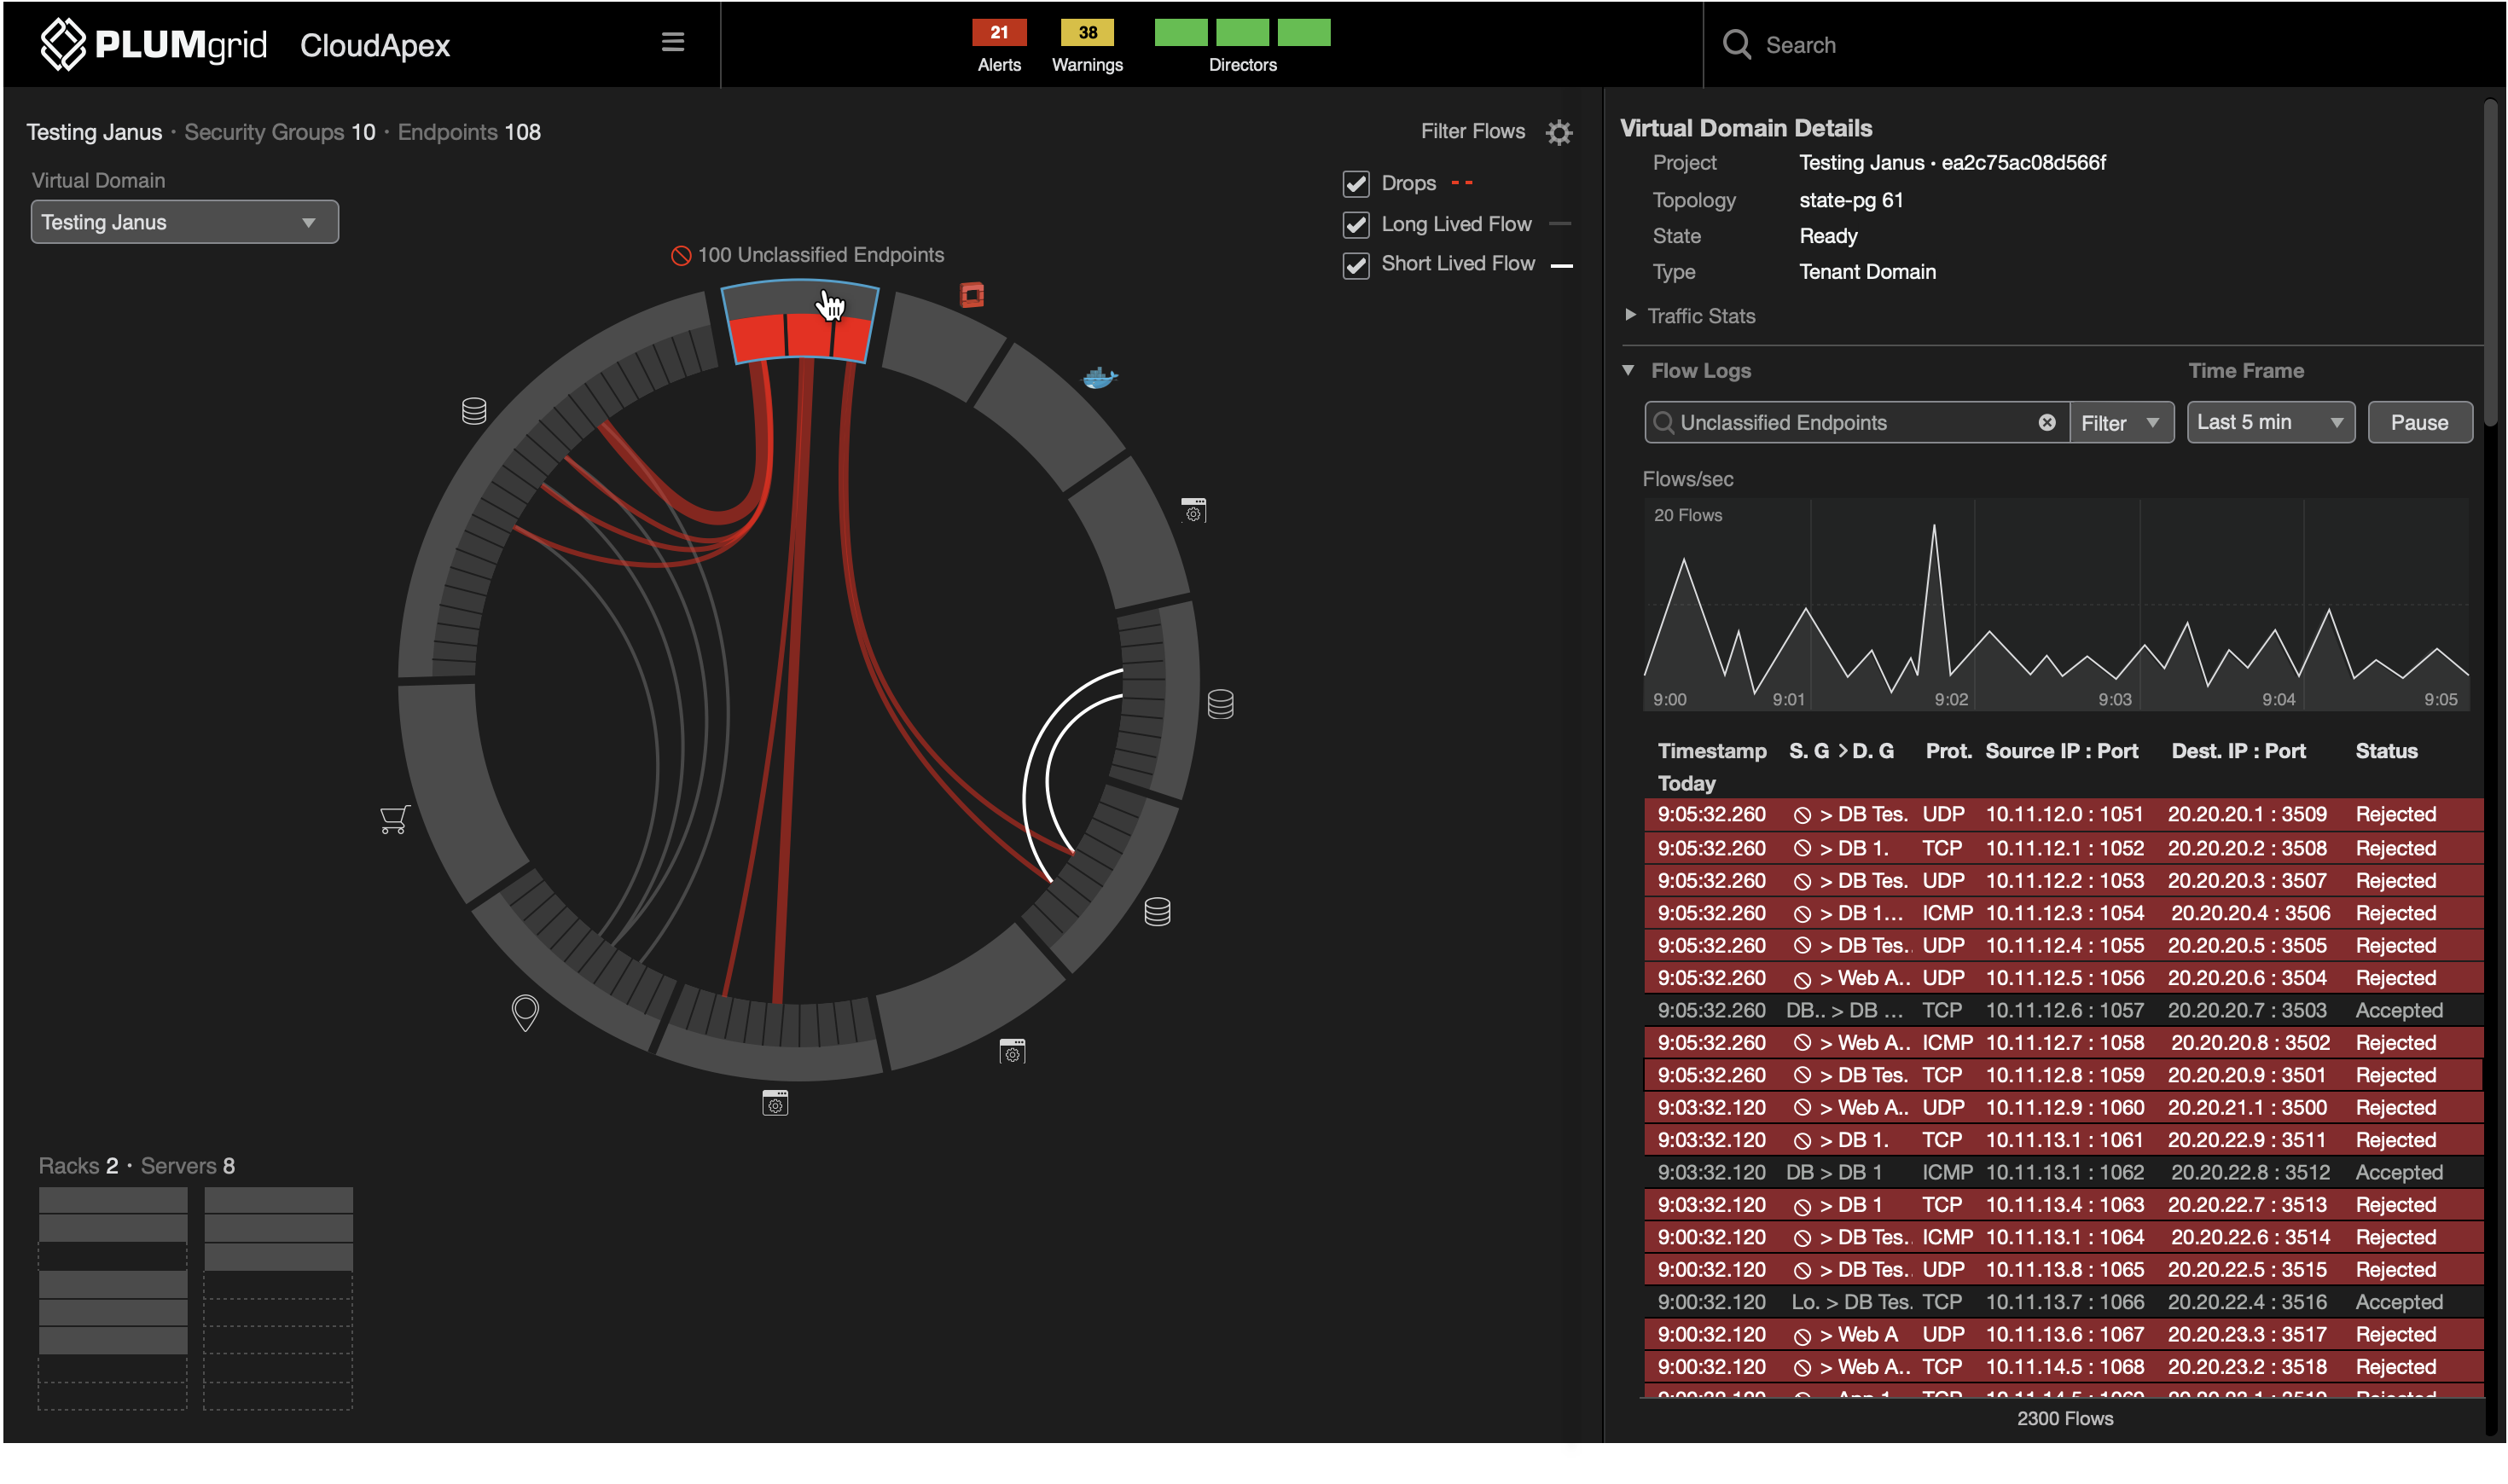
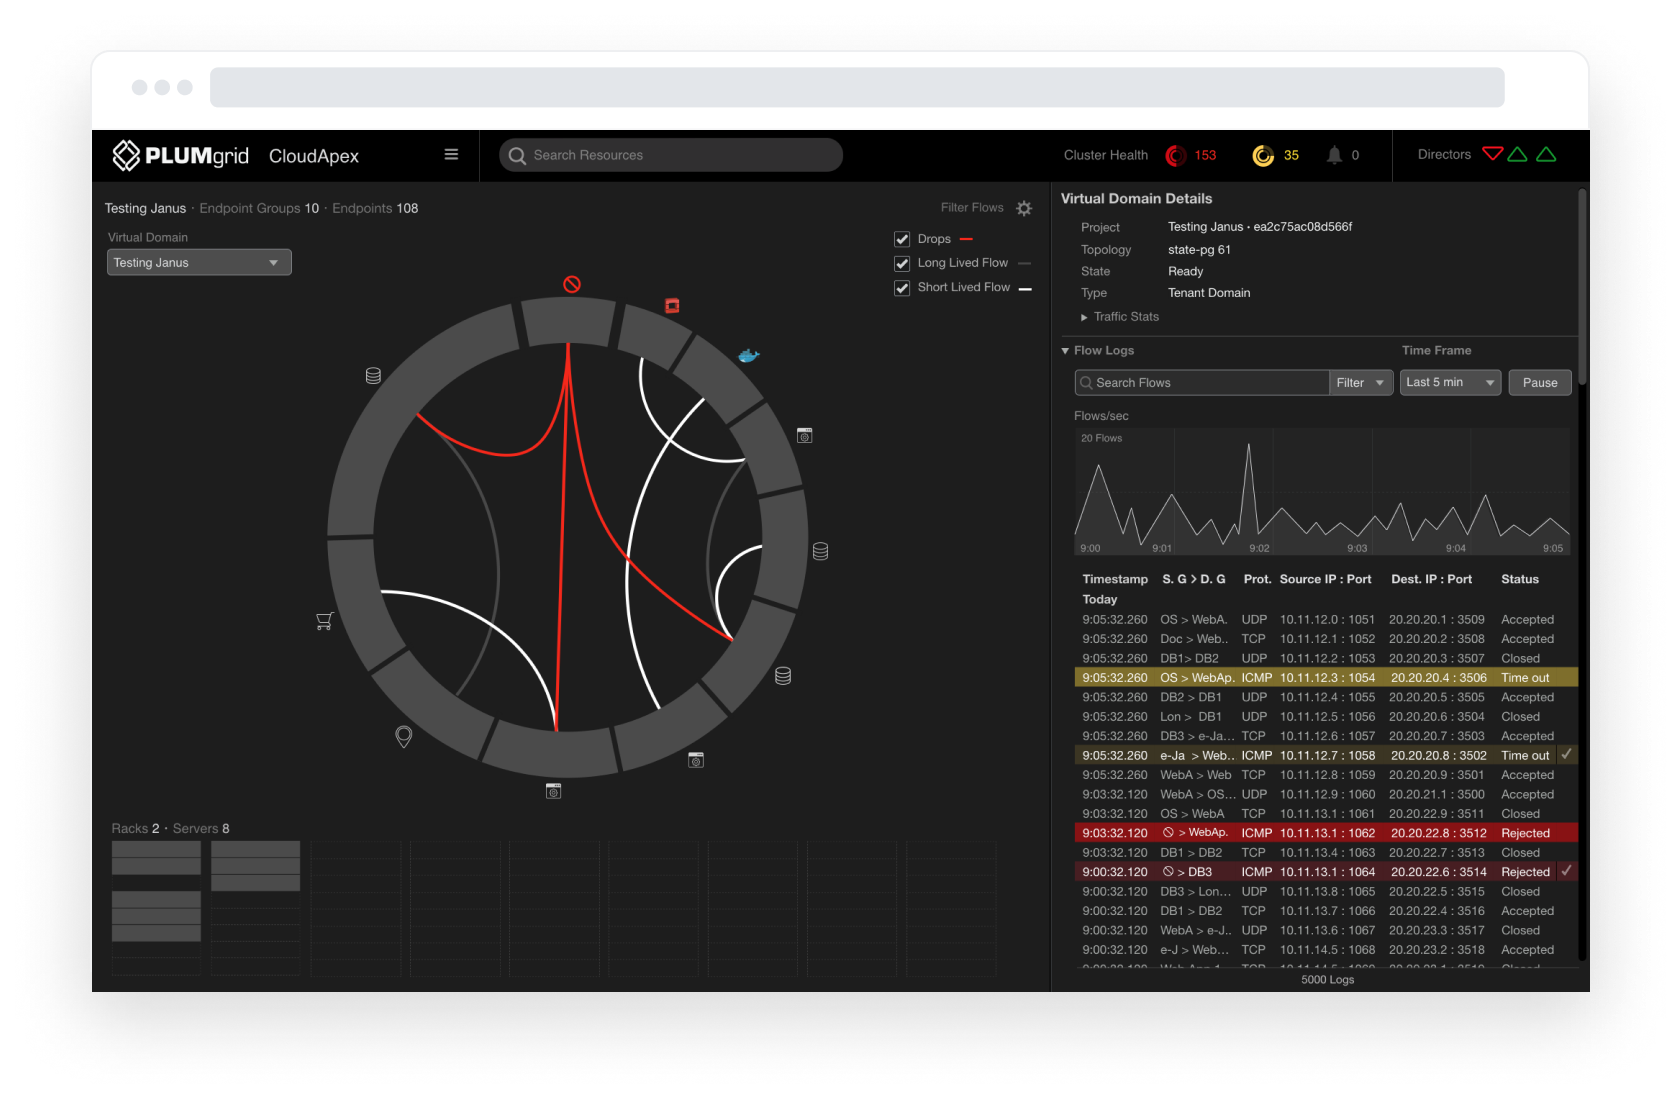
Successful communications are color-coded grey and white, representing low and high traffic, while traffic from unclassified IPs is color-coded red to represent an attack on the network.
The first layer shows the aggregation of current traffic between groups, which can be expanded for detailed views, eg. which specific endpoints (IPs) were responsible for that traffic flow.
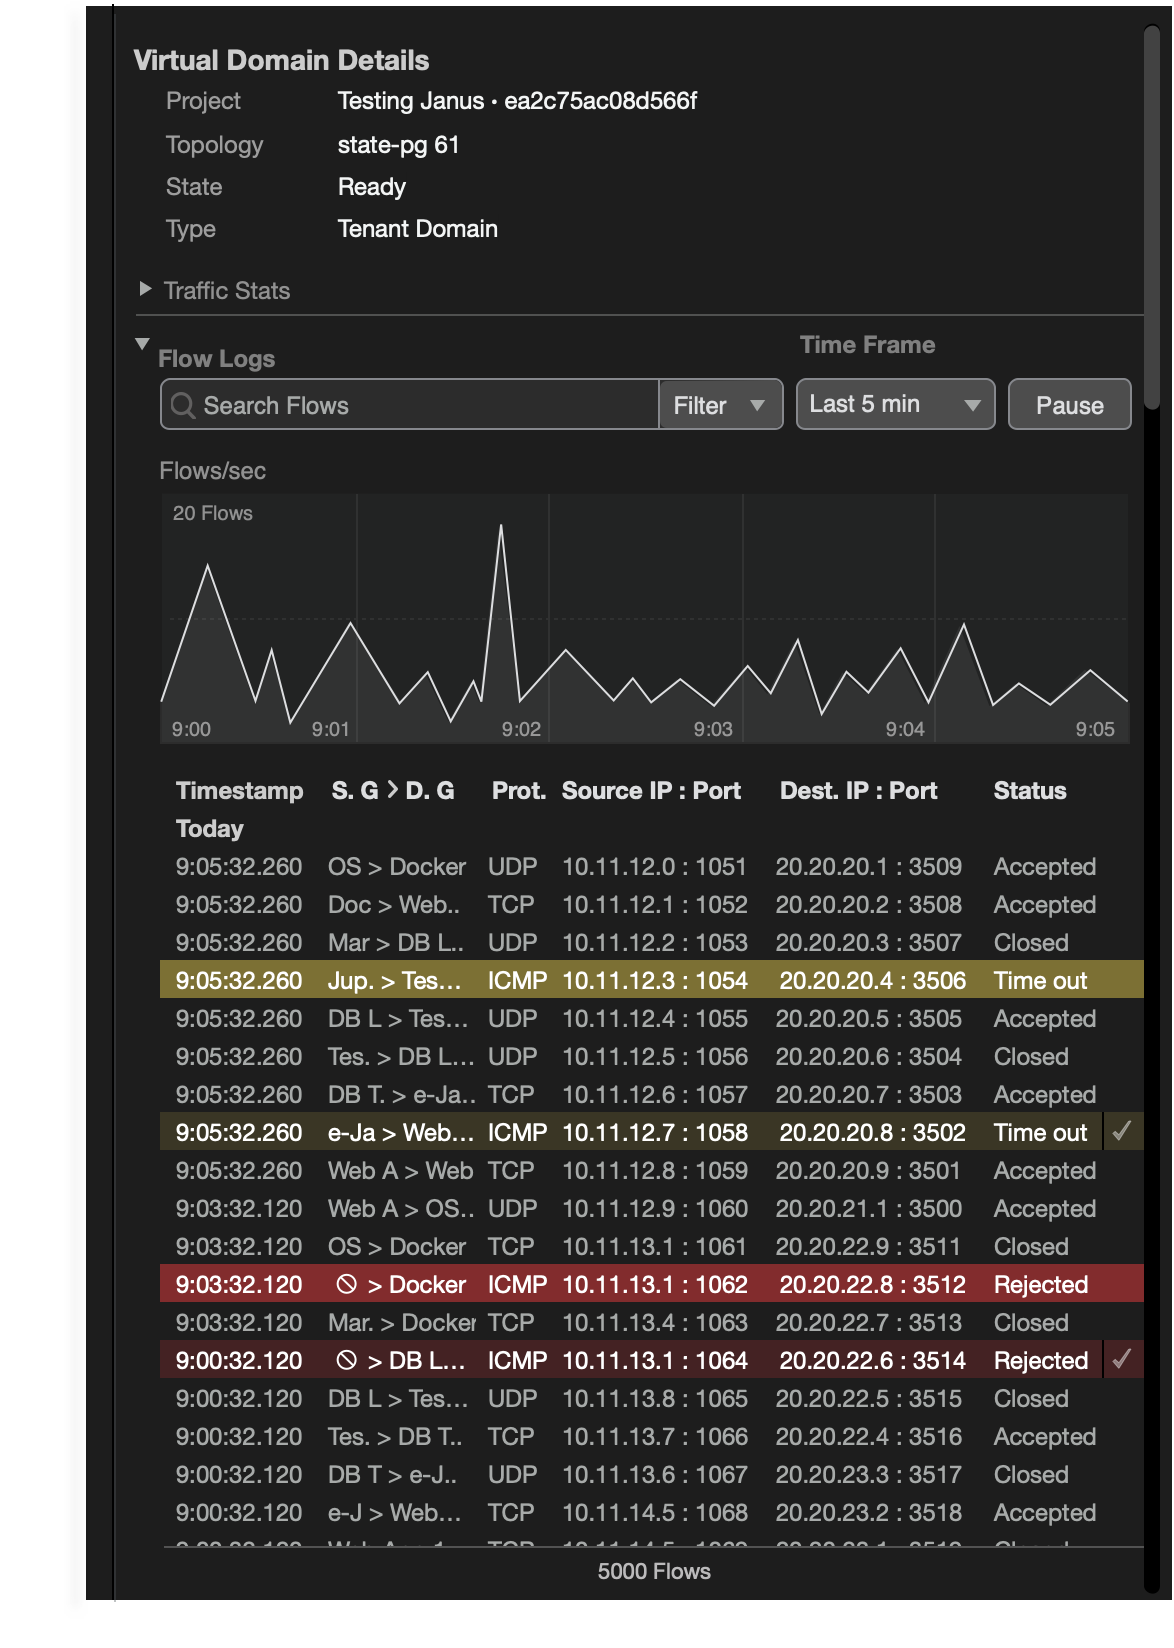
The side panel displays a filtered view of flow logs and a line graph depicting traffic over time, in intervals of hours, minutes, seconds, or milliseconds. This allows the end-user to quickly view information relevant to the network’s security.


Monitoring
Drill Down Workflow
Inside the Attack
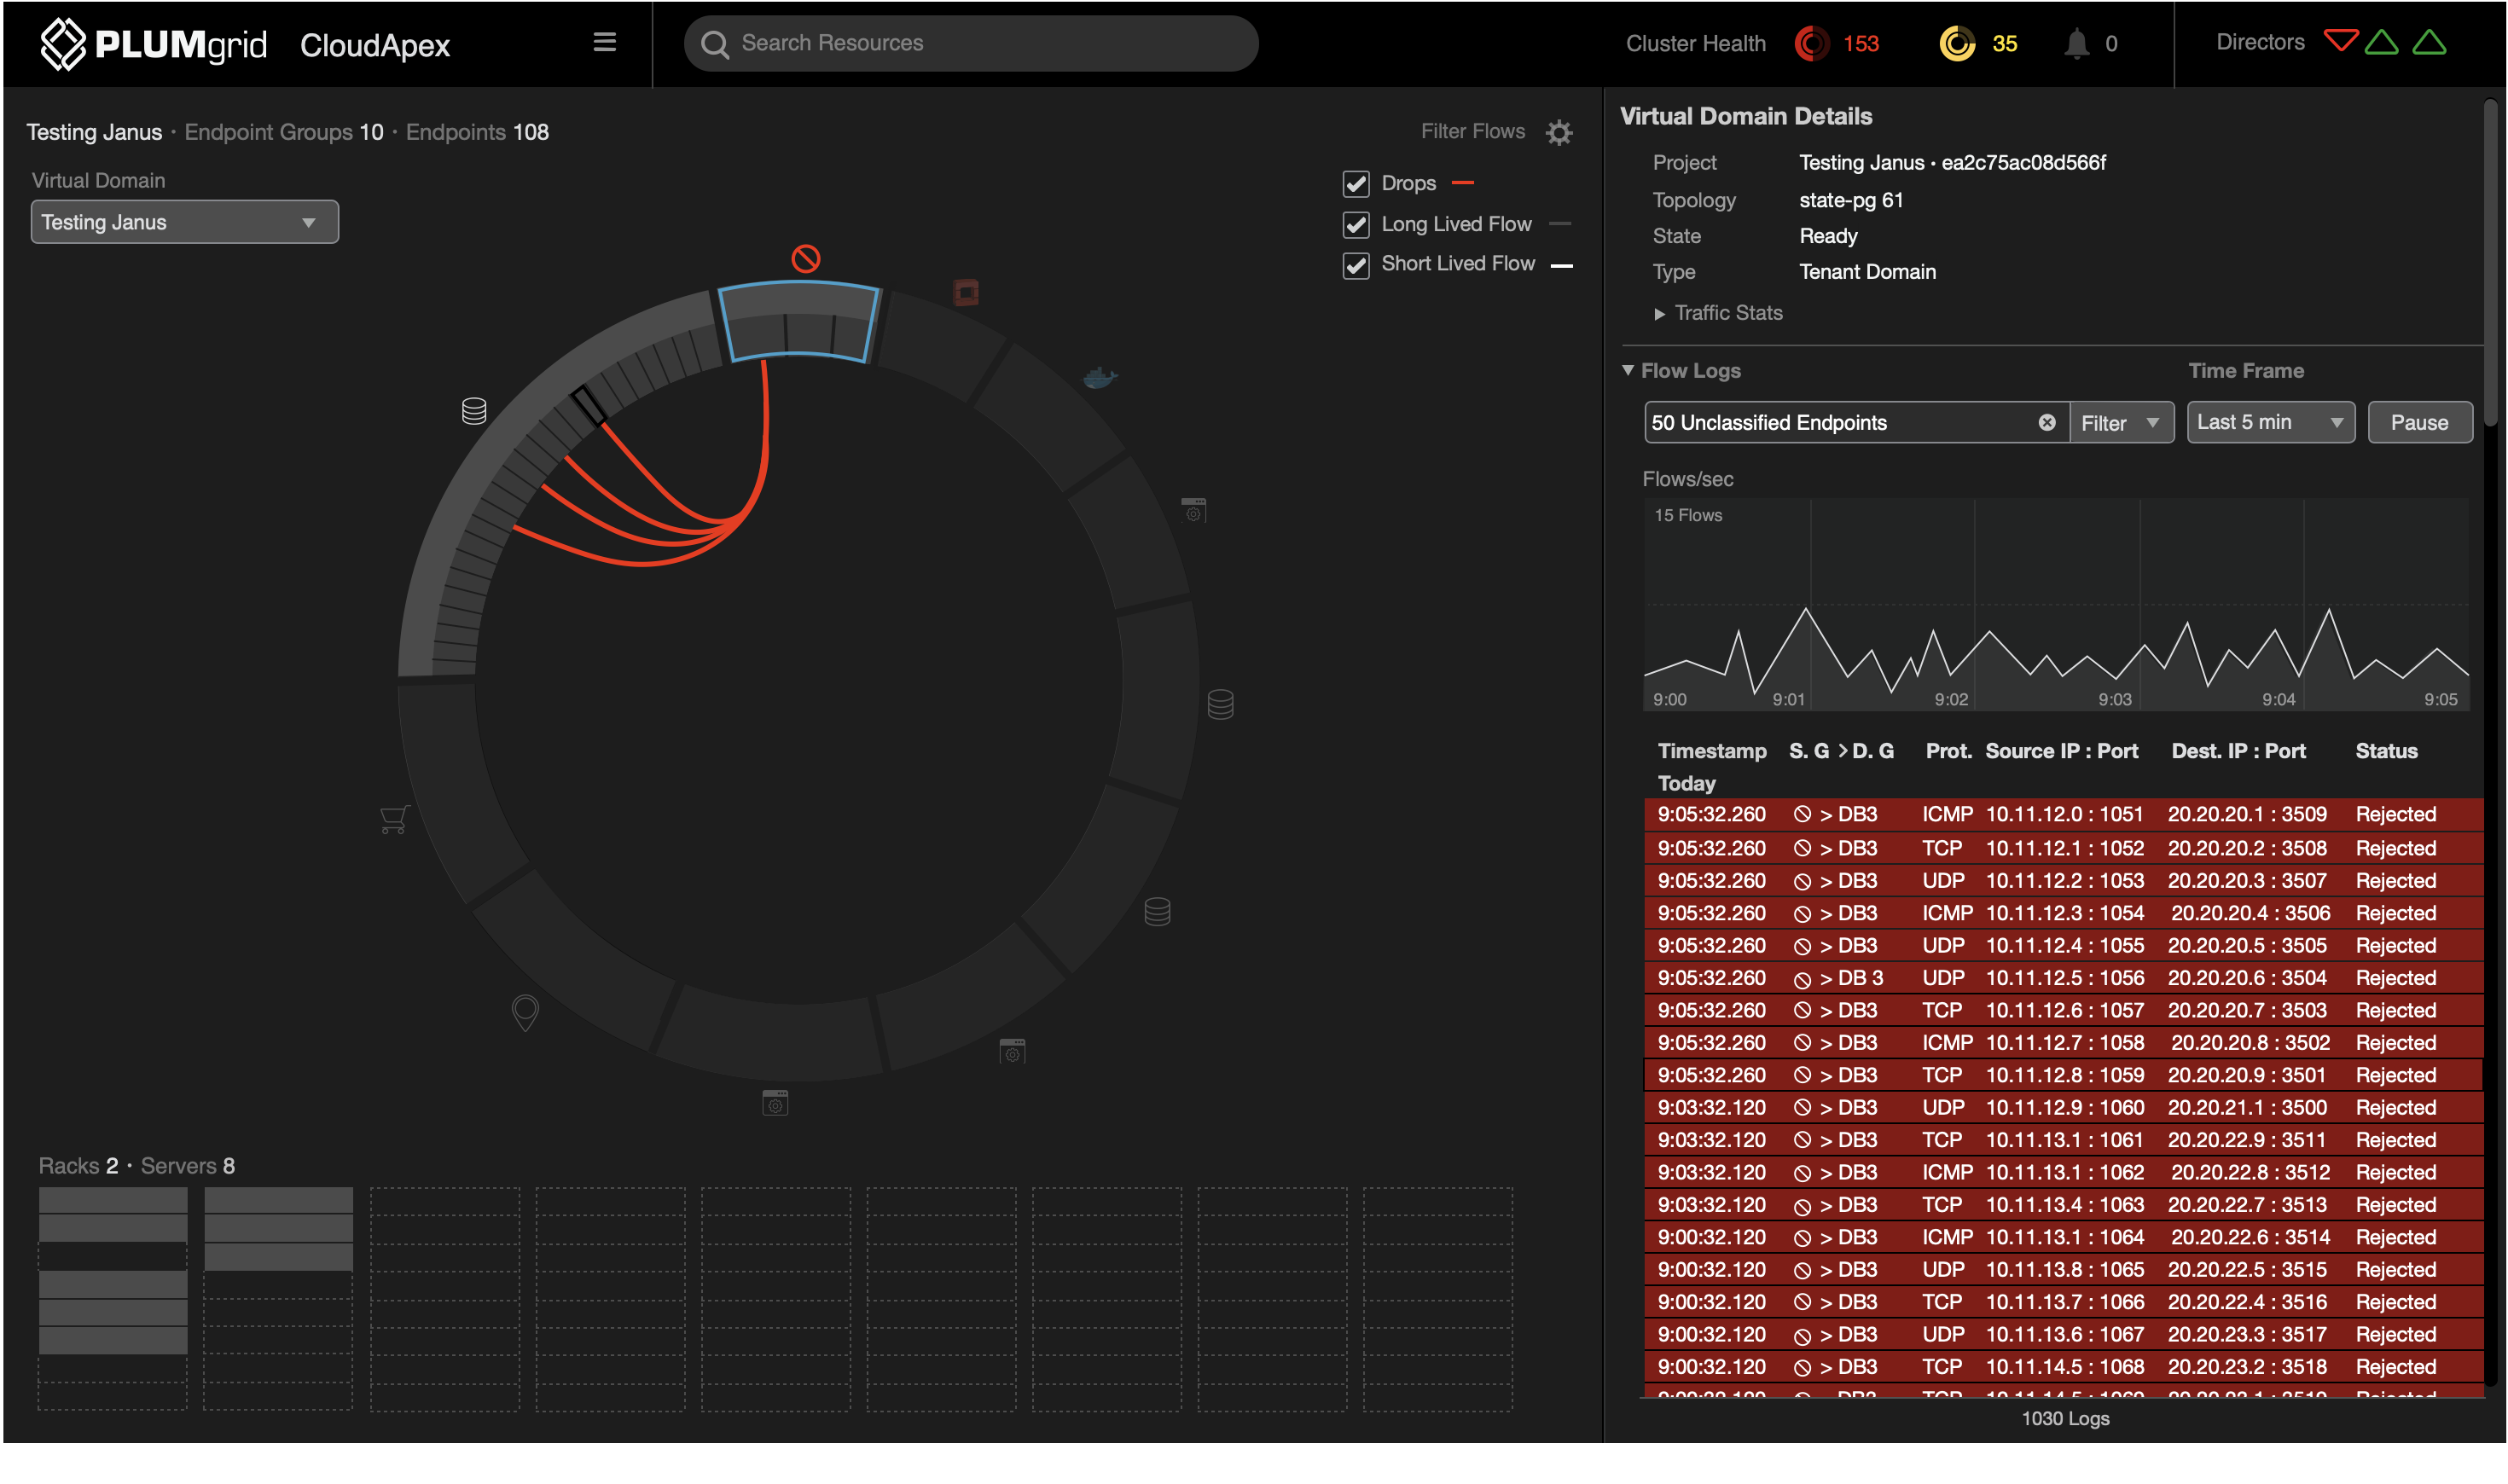
Unclassified endpoints refer to IPs not recognized within accepted connections and protocols.
The dashboard prioritizes this type of traffic, allowing users to isolate it, access detailed logs (e.g., timing, status, IPs), and correlate it with other VMs or containers that have enabled connections. This activity may indicate a coordinated attack.

Multiple ways to drill down granular data — for example, starting from the server level.
View connections between unclassified traffic and other VMs.


The partitioning technique represents datasets containing hierarchical components (parent-child) relationships between data.

Security View
Onboarding
From a blank slate to fully powered by data.


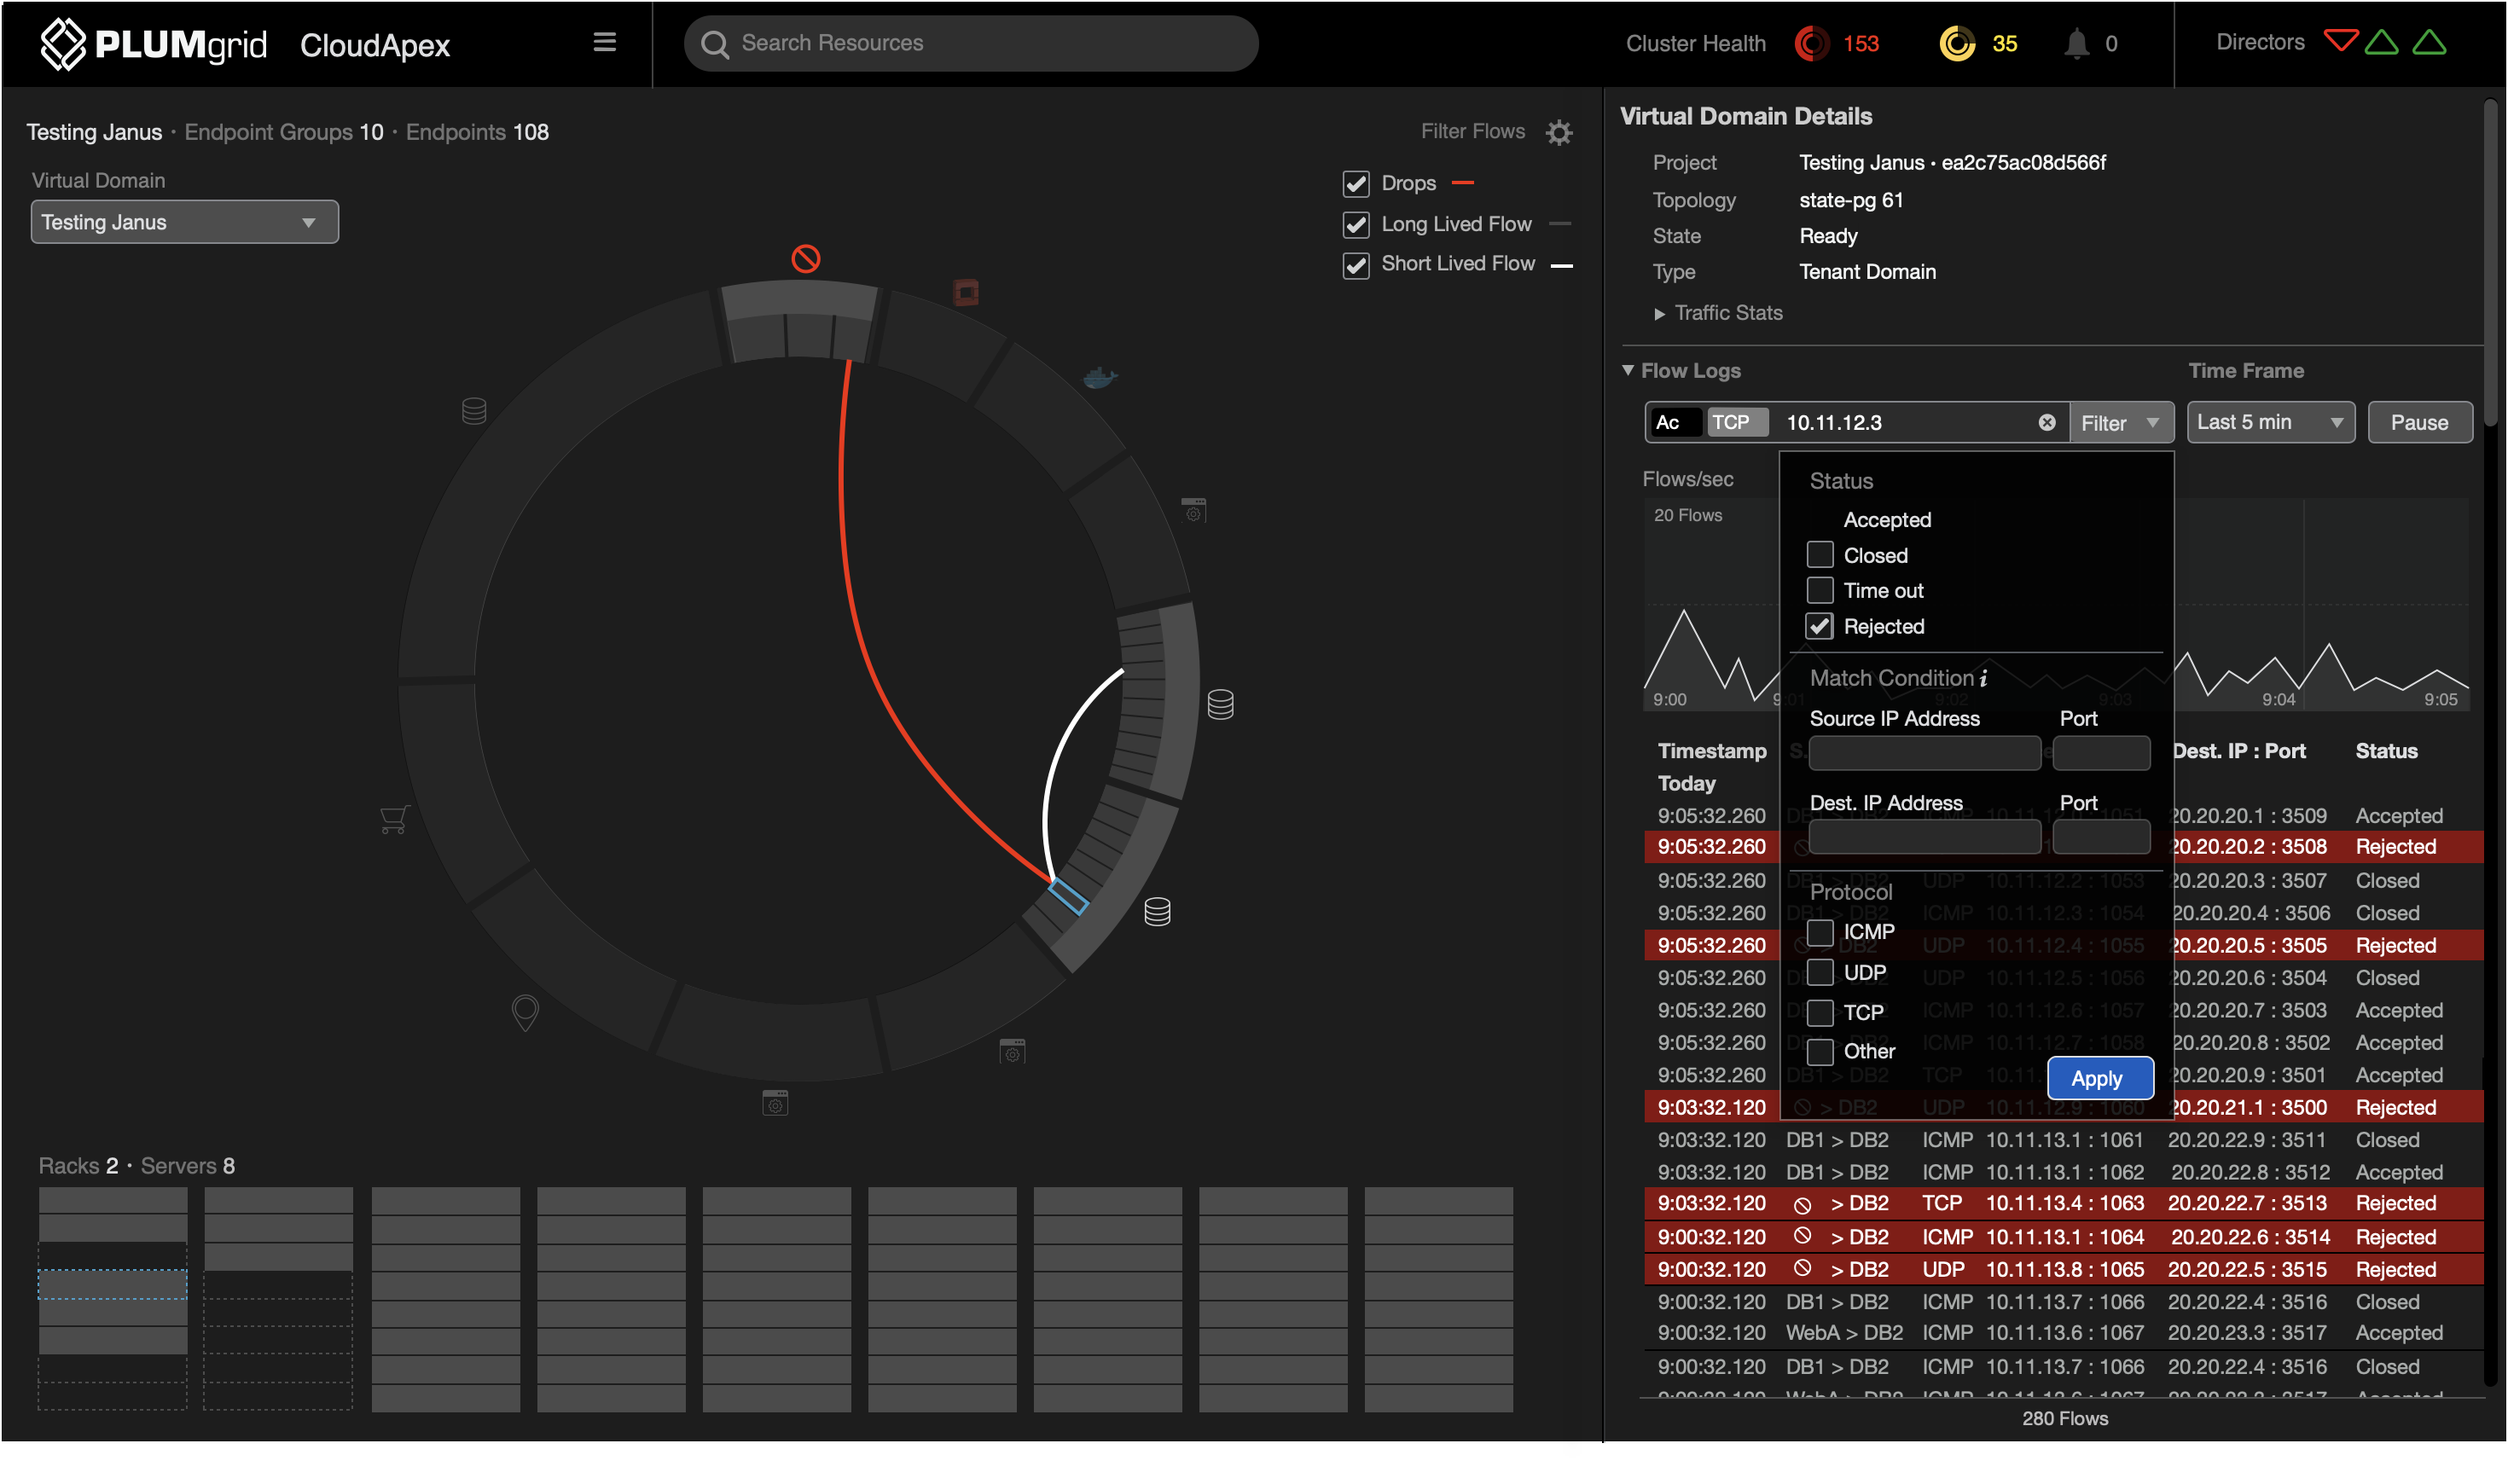
Flow Logs
Filtering
Multiple options to drill down granular traffic data.

Flow Duration
Active Flows
Ability to change and visualize short and lived flows timed from 1 to 180 minutes.


Carolina Pena
Home
About
Contact

Product Design, Data Visualization, & Branding © caperi.me - San Francisco ♥ ATX | Connect
Next Project
Previous Project

240
Endpoints tracked simultaneously, enhancing visibility across of security groups.
98%
Reduced detection time, through layered, interactive exploration features that enabled discovery of hidden network anomalies.
Security View
Enabled real-time visibility into network traffic, allowing security teams to detect and respond to unclassified IP threats targeting sensitive customer data.
My Role
Team
Duration
Product Designer Lead
Chief Technology Officer, Product Manager, Network Engineers, UI Developers, UX Researcher, and Marketing.
2 weeks sprints (6 months)
Figma

Host Detection
Drilldown Traffic
Filter Logs Mechanisms
Overview
Display virtual network traffic in real-time and security alerts from unidentified IPs.
Enable macro views and granular views to quickly identify attacks on customers networks. Provide network details as historical data to troubleshoot and remediate.
“This view should be developed to enable visibility of the security across all customers resources”
Collaborated with cross-functional teams in 2 weeks sprints from ideation to development, conducted internal workshops and 1:1s with the CTO and architecture engineers.
Today, the company and this application have been acquired by VMware.
Problem
Solution
Security View is an incremental section in a product for cloud network visualization dashboard. Displays the relationships between the physical (servers) and the virtual network resources (security groups). This is significantly better than tabular formats seen in many networking products.
My process
Research
Ideation
Design
and Testing
Outcomes
and Lessons
Unclassified/IPs
Security Policies
Security Groups (IP Servers)
Research and
Discovery
We ran workshops to review and break down the requirements for a new view we called Security View. From there, I identified and categorized different types of requirements to inform and shape the UX strategy.
This is a feature in a monitoring application called CloudApex.
Understanding Requirements
Research
Personas
and Findings
- Scalable and Interactive display of changing data sizes in one graphic.
- Highly responsive, needs to react in real-time.
I was able to gather internal data effectively thanks to the deep expertise of our engineers in both cloud and datacenters.
Challenges
Cloud Administrator
Kevin understands the cloud administration and knows the business organization.
Challenges
- Spends many hours in front of monitors
- Excess of loads of data that he is not able to manage
Datacenter Operator
Paul is responsible for the installation, maintenance, provisioning of hardware, and software support.
Challenges
- Takes time to collect old data
- Spends time searching for systems errors
Whiteboarding & Team Alignment
Artifacts Study
Understanding
security groups rules.
Backend capabilities.
New View Integration.
Planning navigation
and application
architecture
Inspired by graphics that access complex systems defined by a larger number of interconnected elements taking the shape of a network.
Internet Map - 2010
A topological map of an active area of the internet.
Chord Diagram
Simplified View
Ideation
Ideation
From sketching to user interface
Many organizations place significant emphasis on the presentation of metadata itself, rather than exploring the deeper relationships between metadata and the external factors that influence security outcomes.
We prioritize identifying what is going wrong within the network—pinpointing vulnerabilities, anomalies, or breaches—before assigning responsibility or tracing the issue to specific entities.
COMPETITIVE & Comparative Analysis
Understanding Network Solutions
Tabular Views
Cognitive Load
Disconnected Graphs

The circle can hold 40 VMs/containers required as 280 Items to scale.
The partitioning technique represents datasets containing hierarchical components (parent-child) relationships between data.
Can hold macro and micro views as keep relationships.
Circles and segmentation can represents grouping and symbolize contention.
Wires represent an end-to-end endpoint
relationship.
Data visualization done correctly can encode more information, makes easier to identify patterns and trends than looking through thousands of rows on a table.
- The objective is to have the most important information readily and effortlessly available.
- Quickly point out/highlight unclassified IP’s that deserves immediate attention.
- Use drilling down methods.
- Achieve eloquence thought simplicity.
Why Data Visualization using a Dashboard?
Explored D3 libraries to understand graphics behaviors.
View Security Policies
Design
Design
and Testing
Security Groups View is a section of a monitoring application that displays all virtual (VMs and containers) and physical resources (servers) associated with a customer. Users can access this view through two distinct menu paths.
Security Policies are applied in
a configurational platform to the virtual domains endpoints, and Security Groups View is the result of it.
Dashboard Functionalities
Understands users and their needs. The data offered was vast and changing, it was important to offer in a glance the information the users needed immediately.
Design with scale in mind. Build a solution that can scale along with SDN technology and provide solutions to front-end.
Explore other ways of displaying data. Try and find analogies that bring more meaningful meanings for the user as humans, visually interesting, and explore different ways of expressing and encoding the data… variation of color, shape, movement, proximity, and relationships, etc.
Takeaways
UX Solution
Security Groups
Successful communications are color-coded grey and white, representing low and high traffic, while traffic from unclassified IPs is color-coded red to represent an attack on the network.
The first layer shows the aggregation of current traffic between groups, which can be expanded for detailed views, eg. which specific endpoints (IPs) were responsible for that traffic flow.
The side panel displays a filtered view of flow logs and a line graph depicting traffic over time, in intervals of hours, minutes, seconds, or milliseconds. This allows the end-user to quickly view information relevant to the network’s security.
Monitoring
Drill Down Workflow
Inside the Attack
Unclassified endpoints refer to IPs not recognized within accepted connections and protocols.
The dashboard prioritizes this type of traffic, allowing users to isolate it, access detailed logs (e.g., timing, status, IPs), and correlate it with other VMs or containers that have enabled connections. This activity may indicate a coordinated attack.
Multiple ways to drill down granular data — for example, starting from the server level.
View connections between unclassified traffic and other VMs.
The partitioning technique represents datasets containing hierarchical components (parent-child) relationships between data.
Security View
Onboarding
From a blank slate to fully powered by data.
Flow Logs
Filtering
Multiple options to drill down granular traffic data.
Flow Duration
Active Flows
Ability to change and visualize short and lived flows timed from 1 to 180 minutes.
Carolina Pena
Home
About
Contact